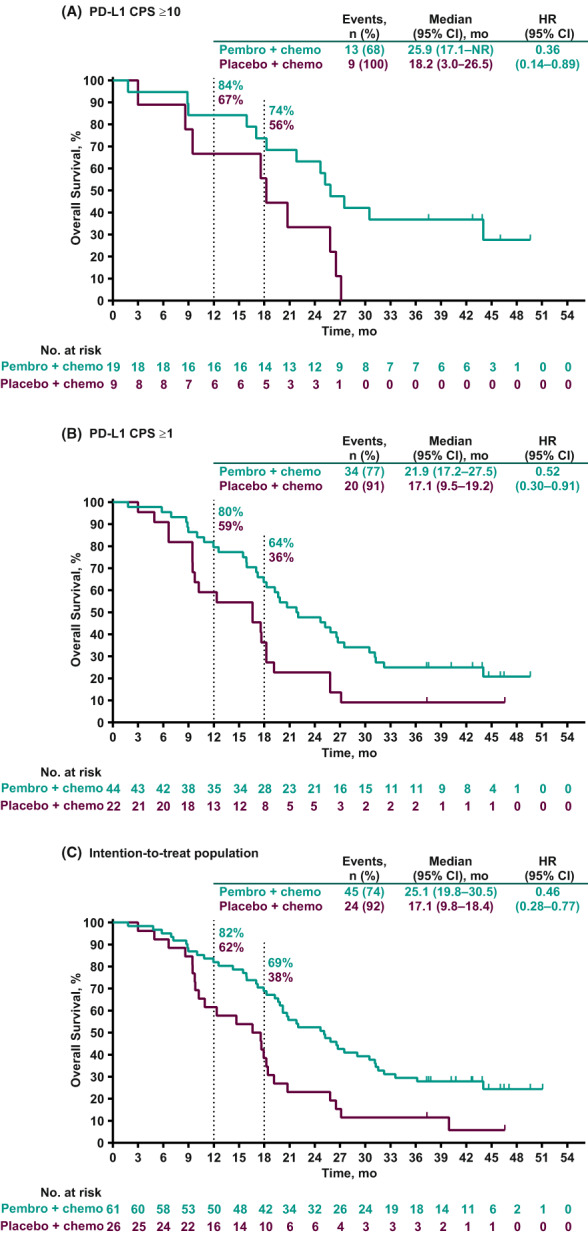
FIGURE 2.

Overall survival in (A) patients with PD‐L1 CPS ≥10 tumors, (B) patients with PD‐L1 CPS ≥1 tumors, and (C) the intention‐to‐treat population. CPS, combined positive score; HR, hazard ratio; NR, not reached; PD‐L1, programmed cell death ligand 1.
