FIGURE 3.

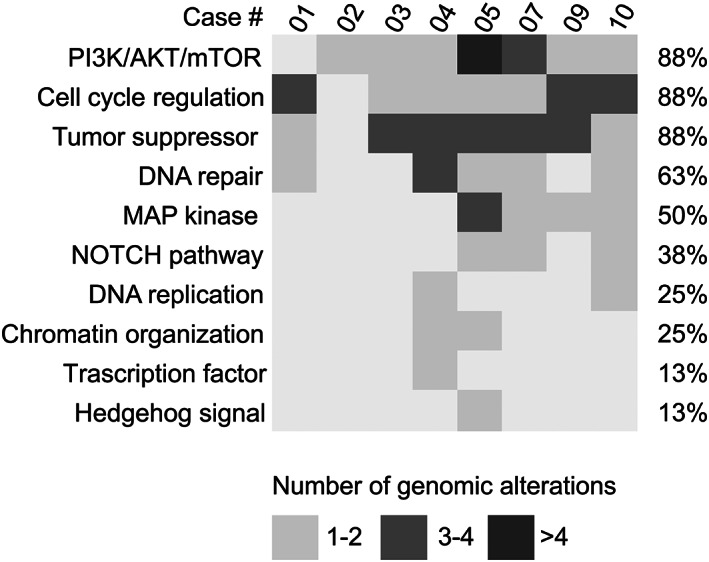
Recurrently altered pathways in breast MECs. Each column represents a patient, each row a pathway; the number of molecular aberrations is annotated as reported on the bottom.

Recurrently altered pathways in breast MECs. Each column represents a patient, each row a pathway; the number of molecular aberrations is annotated as reported on the bottom.