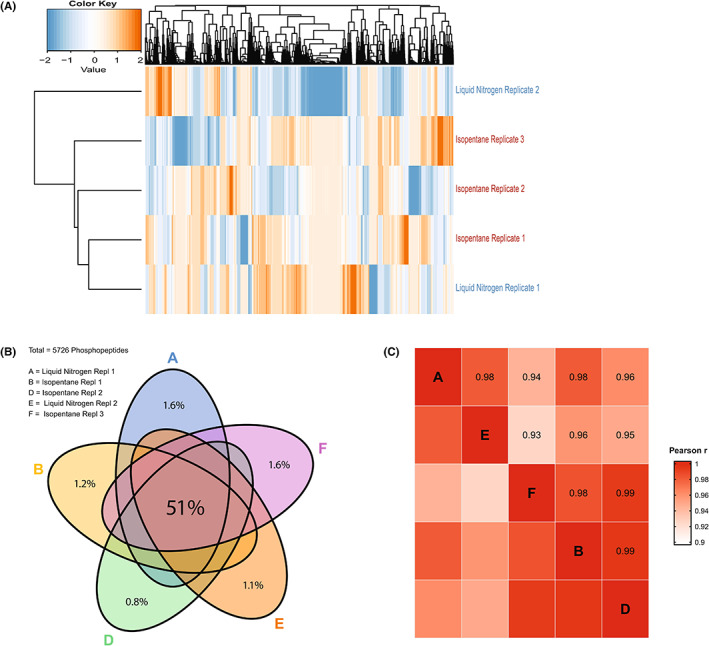
FIGURE 4.

Effect of freezing rate on HCT116 phosphoproteomic profile. Effect of freezing rate on the phosphoproteome of cancer cell line HCT116. HCT116 samples were frozen in polypropylene vials in either liquid nitrogen (−196°C, in 2 s, N = 2; one sample was lost due to a technical error in the mass spectrometer) or in 25 s using pre‐cooled isopentane (−80°C, N = 3). (A) Unsupervised cluster analysis of all identified phosphopeptides does not separate samples with highest versus lowest freezing rate. (B) Venn diagram of overlapping phosphopeptides between all five samples shows reproducible phosphopeptide identification regardless of freezing rate. (C) Correlation by Pearson's r shows high correlation between phosphoproteomic profiles of samples frozen at high versus lower rate.
