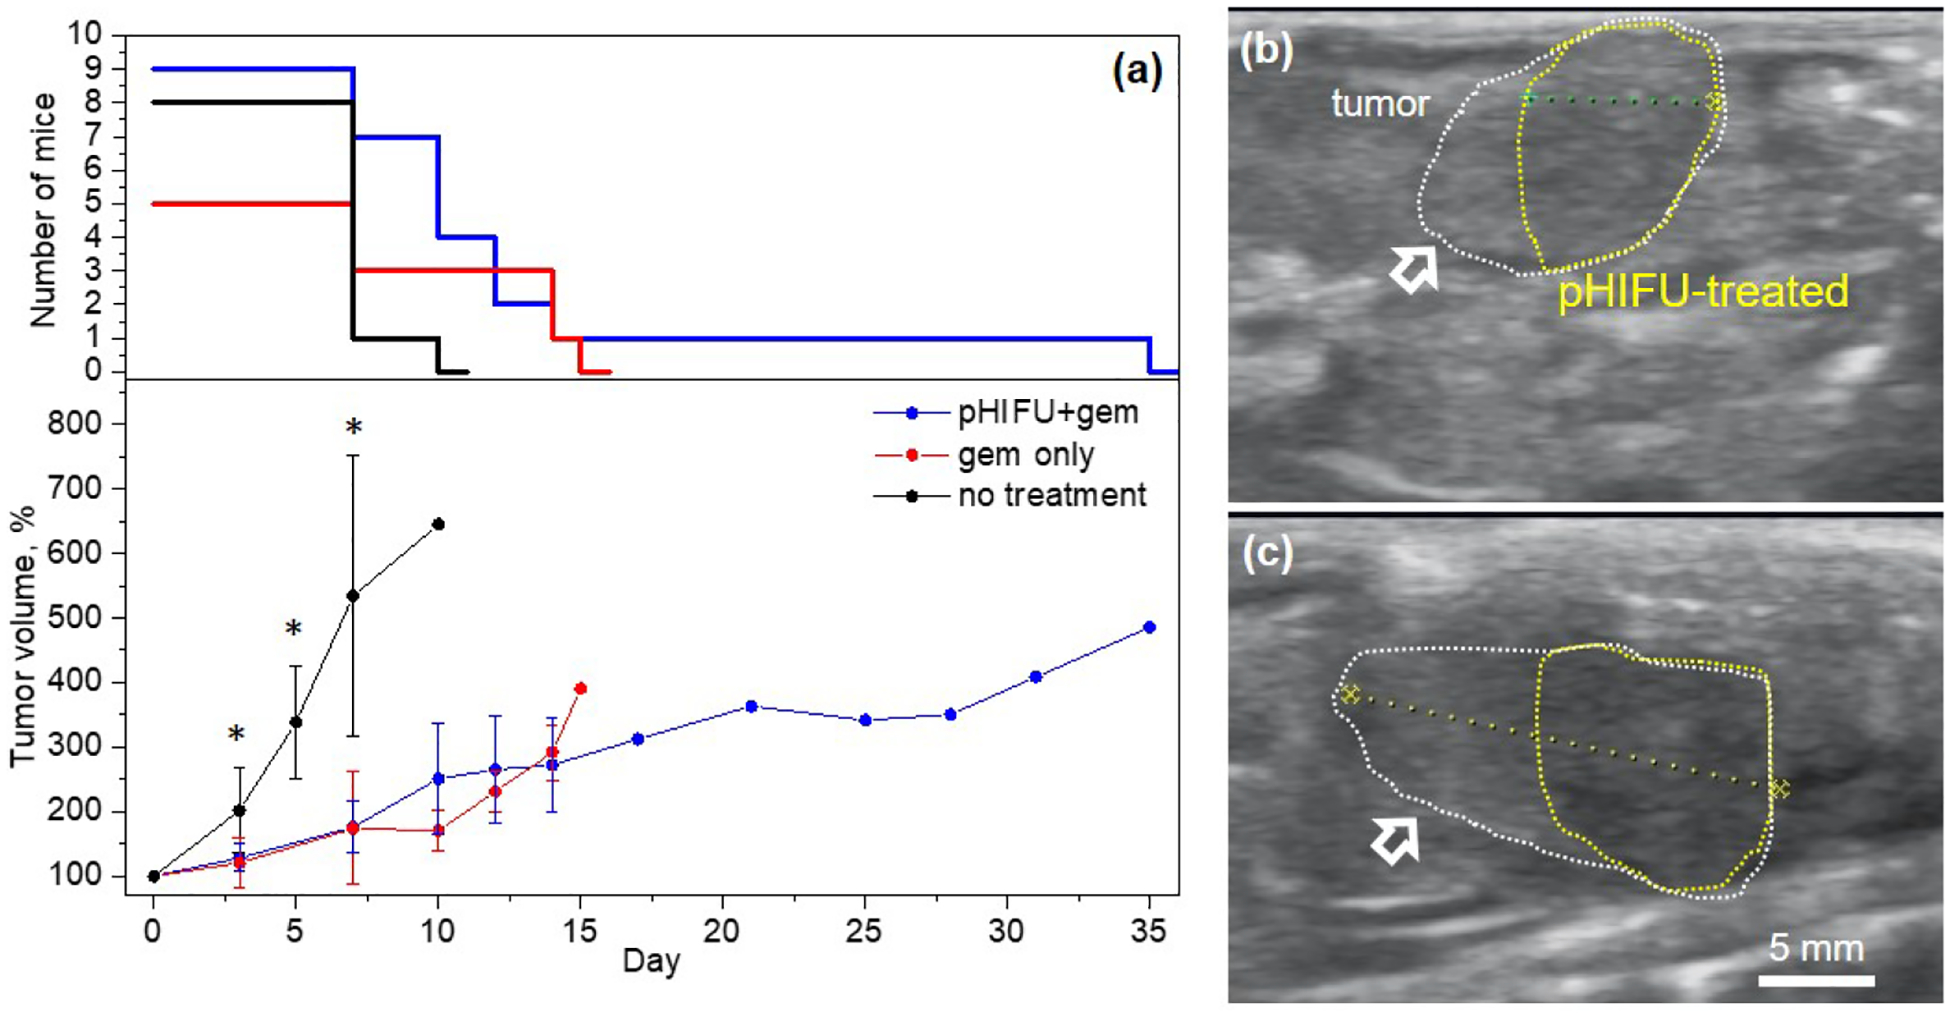
Figure 2.

(a) Tumor growth curves for the three experimental groups; error bars correspond to standard deviation; upper graph indicates the number of mice in each group at each time point. Tumor sizes in both treatment groups are significantly smaller than those in the no treatment control group at 3–7 day time points (*p < 0.05) The difference between the tumor sizes in the treatment groups is not statistically significant at any time point in the observation period, and a trend towards tumor growth retardation in pHIFU+gem group is only observed after day 14, which also coincided with the endpoint for most mice in that group. (b),(c) Representative US B-mode images of a tumor (white dotted line) treated with pHIFU immediately after and 21 days after treatment, respectively. Note that pHIFU was only applied to acoustically accessible areas of the tumor (yellow dotted line) not obstructed by bowel gas. The pHIFU-treated area consistently appeared slightly hypoechoic throughout the observation period and did not appreciably change in size, whereas the untreated area of the tumor (white arrows) continued to grow.
