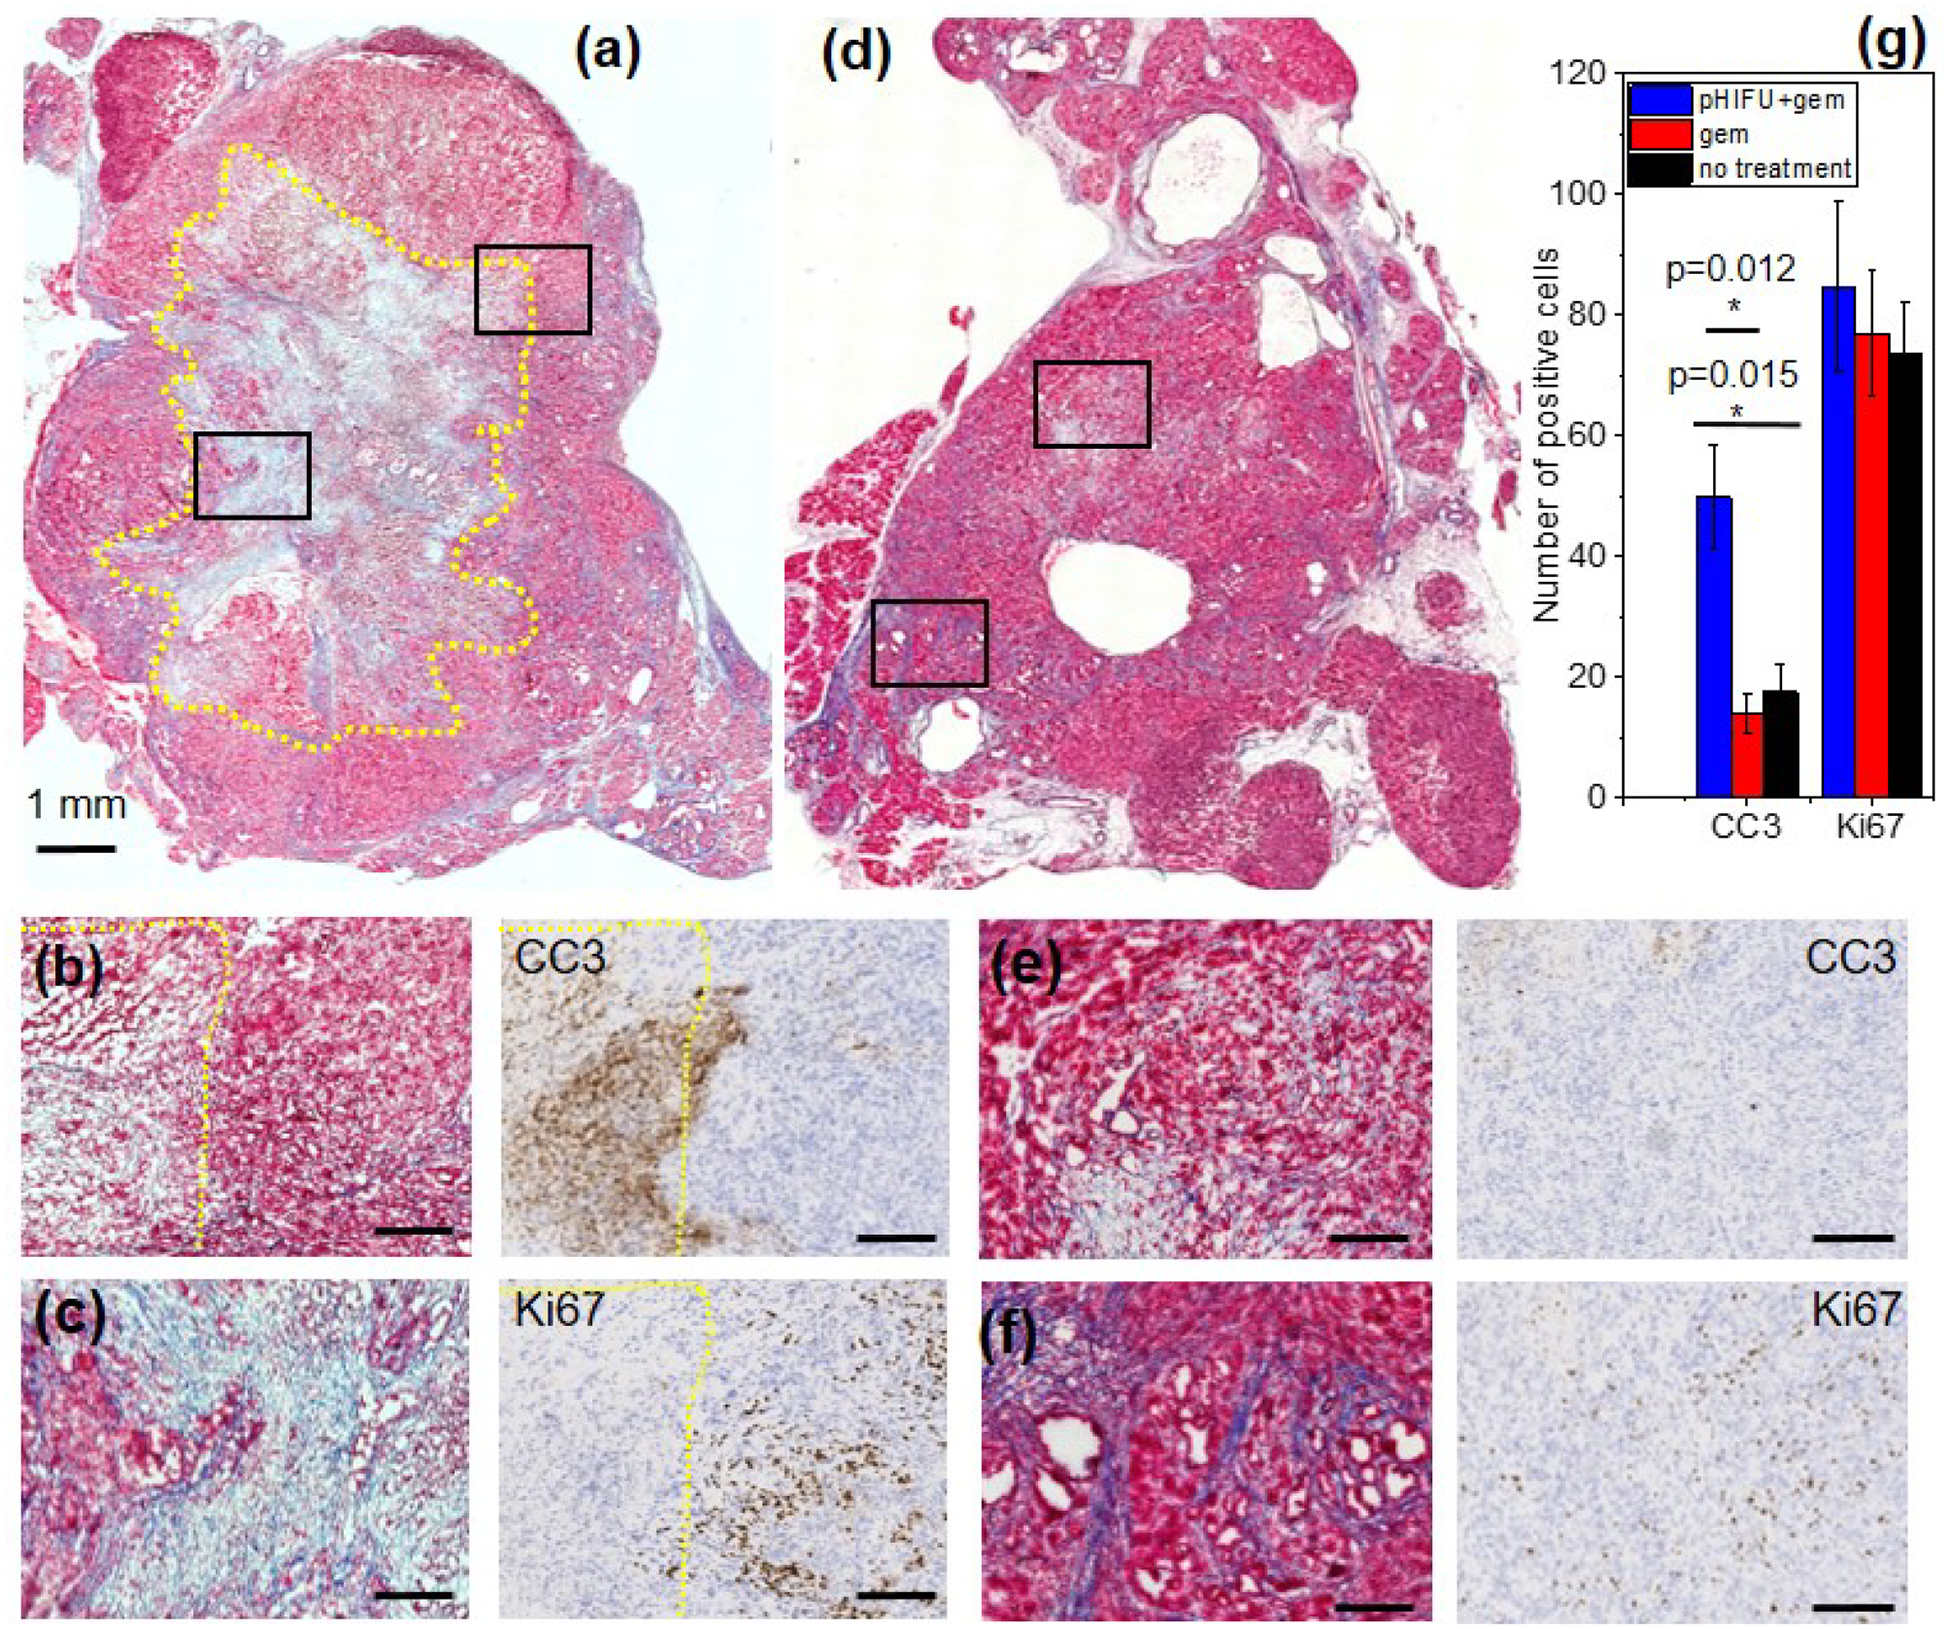
Figure 3.

(a) Representative serial histological sections stained with Masson’s Trichrome (MT), caspase-3 (CC3) and Ki67 of a tumor from pHIFU +gem ((a), (b) (c)) and gem only ((d), (e) (f)) treatment groups. (a) The pHIFU-treated region is outlined with yellow dotted line, and is mostly necrotic, with loss of cell structure, fragmented cells and areas of disrupted collagen fibers. Higher magnification images correspond to the black frames in (a) and show the more glandular (b) and more fibrous (c) areas of the tumor. IHC images corresponding to (b) show bright positive CC3 staining at the border and inside of the treated region, and no Ki67-positive staining, indicating that cells are damaged beyond repair. Conversely, the surrounding untreated tumor tissue contains few CC3-positive cells, but fairly uniform Ki67-positive staining. (d) Low magnification image shows the typical heterogeneity of KPC tumor structure, with glandular areas with occasional small regions of necrosis (higher magnification image in (e)) and more fibrous areas (higher magnification image in (f)). IHC images corresponding to (e) show occasional CC3-positive staining at and surrounding the areas of necrosis, as well as uniform Ki67-positive staining outside of those areas comparable to that in the periphery of pHIFU-treated tumor. Scale bar in all high magnification images is 250 μm). MT and IHC images for no treatment group were similar to those in gem only group (Supplementary Fig.S1). (g) IHC quantification (error bars represent standard error) showing no difference in Ki-67-positive staining between the experimental groups, and significantly larger number of CC3-stained cells in pHIFU-treated tumors.
