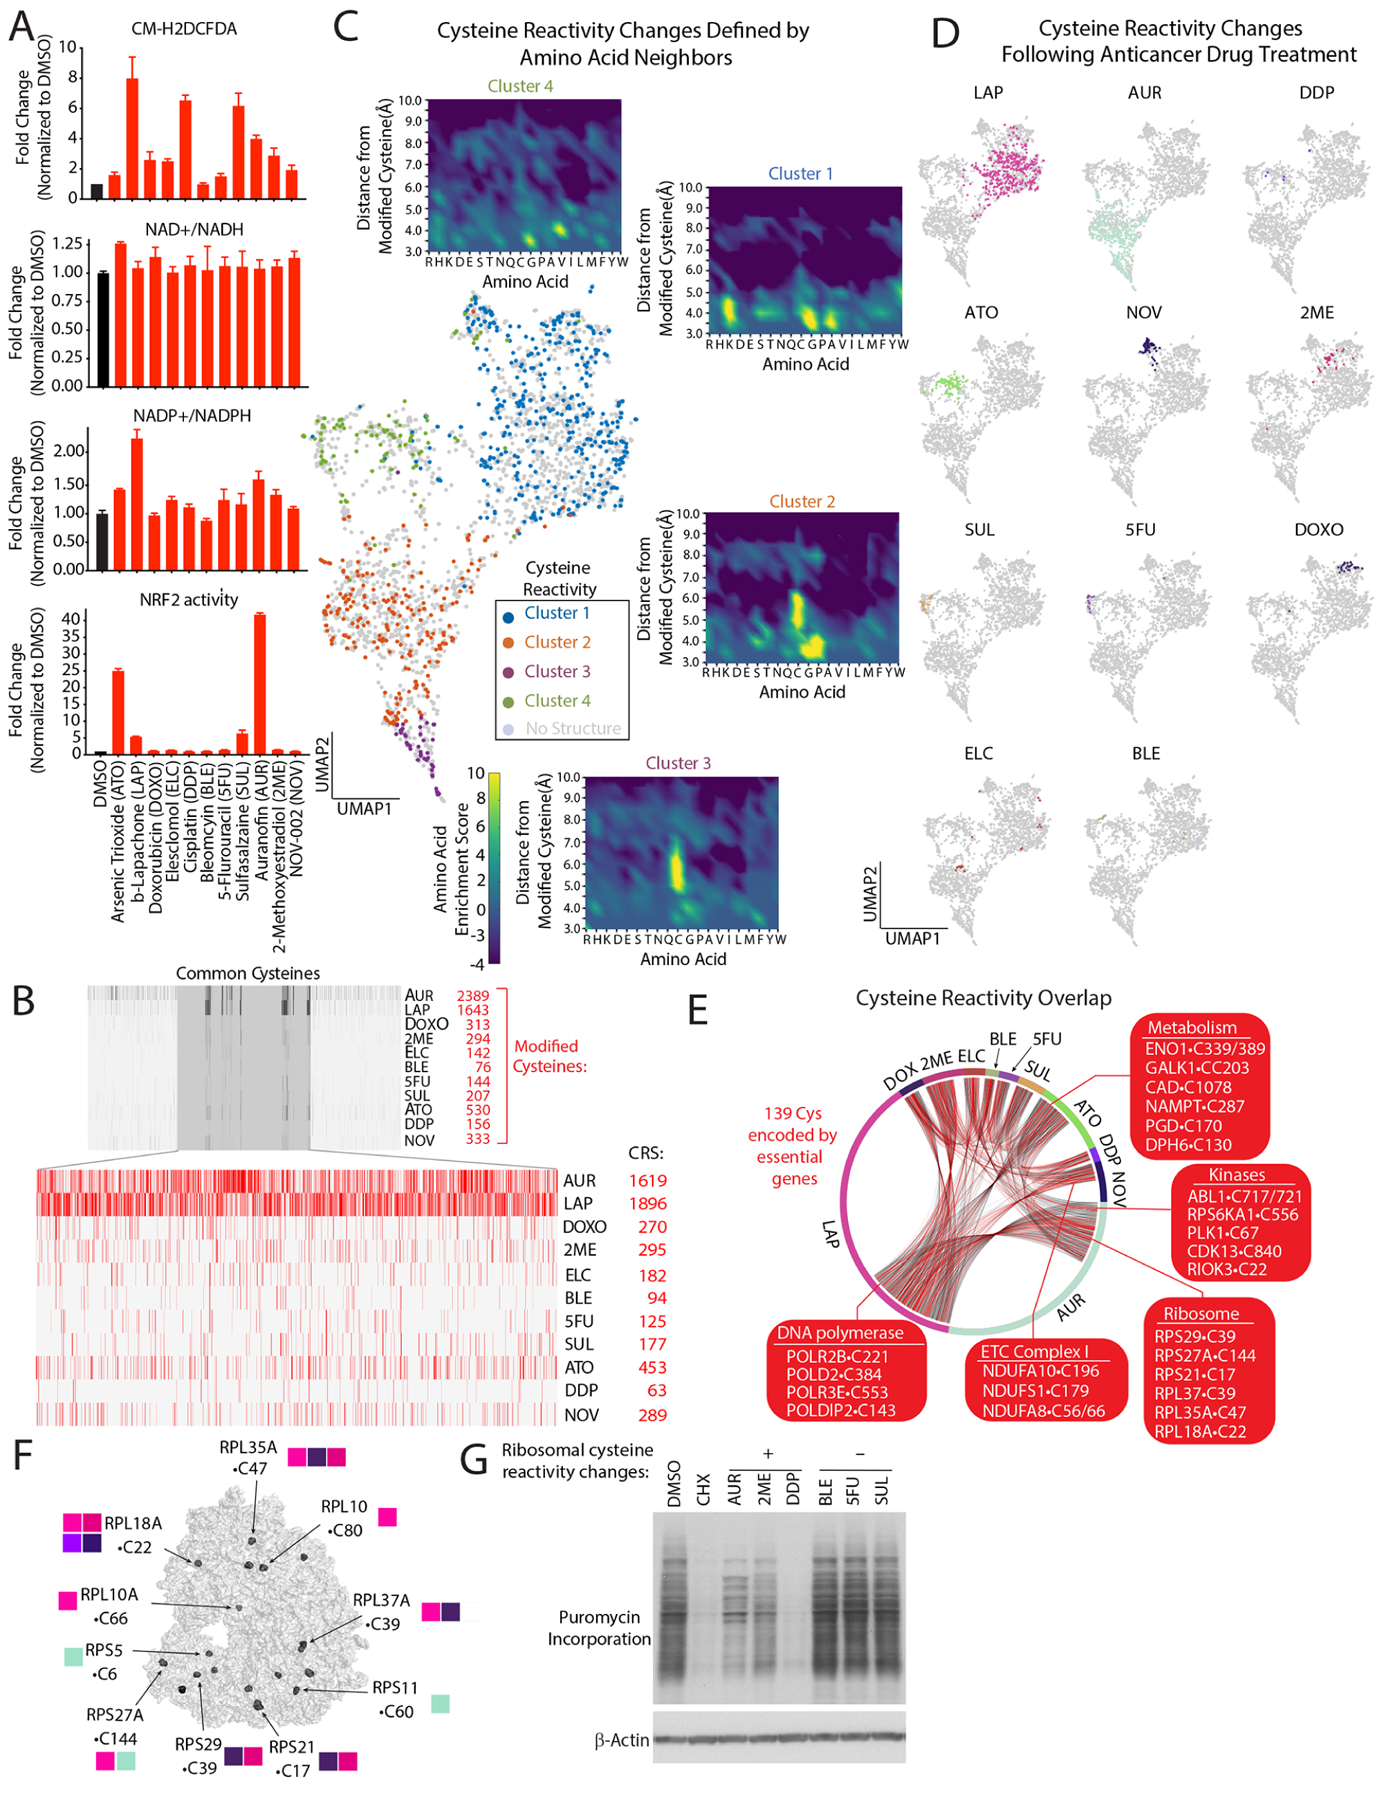
Figure 1: Defining cysteine targets of anticancer drugs with chemical proteomics.

(A) Anticancer drugs regulate steady-state levels of ROS and antioxidant response pathways (see also Figure S1B). (B) Barcode plot of modified cysteines following treatment with the indicated agents and corresponding cysteine reactivity score (CRS) (see also methods, Table S2A). (C) UMAP representation of commonly detected cysteines regulated by anticancer drugs reveals they are localized to four distinct clusters which are color-coded based on available structures. Insets, enrichments plots of residues within a 10Å radial-sphere of reactive cysteines (see methods, Tables S2C). (D) UMAP of cysteine reactivity changes following treatment with indicated agents. (E) Connectivity diagram for shared cysteine targets of anticancer agents. (F) Ribosomal cysteines regulated by anticancer drugs. Adapted from PDB ID: 5LKS97. (G) Anticancer treatments blocks protein synthesis. Immunoblot analysis of puromycin incorporation into nascent proteins following treatment with the indicated compounds. Data are represented as mean ± SEM.
