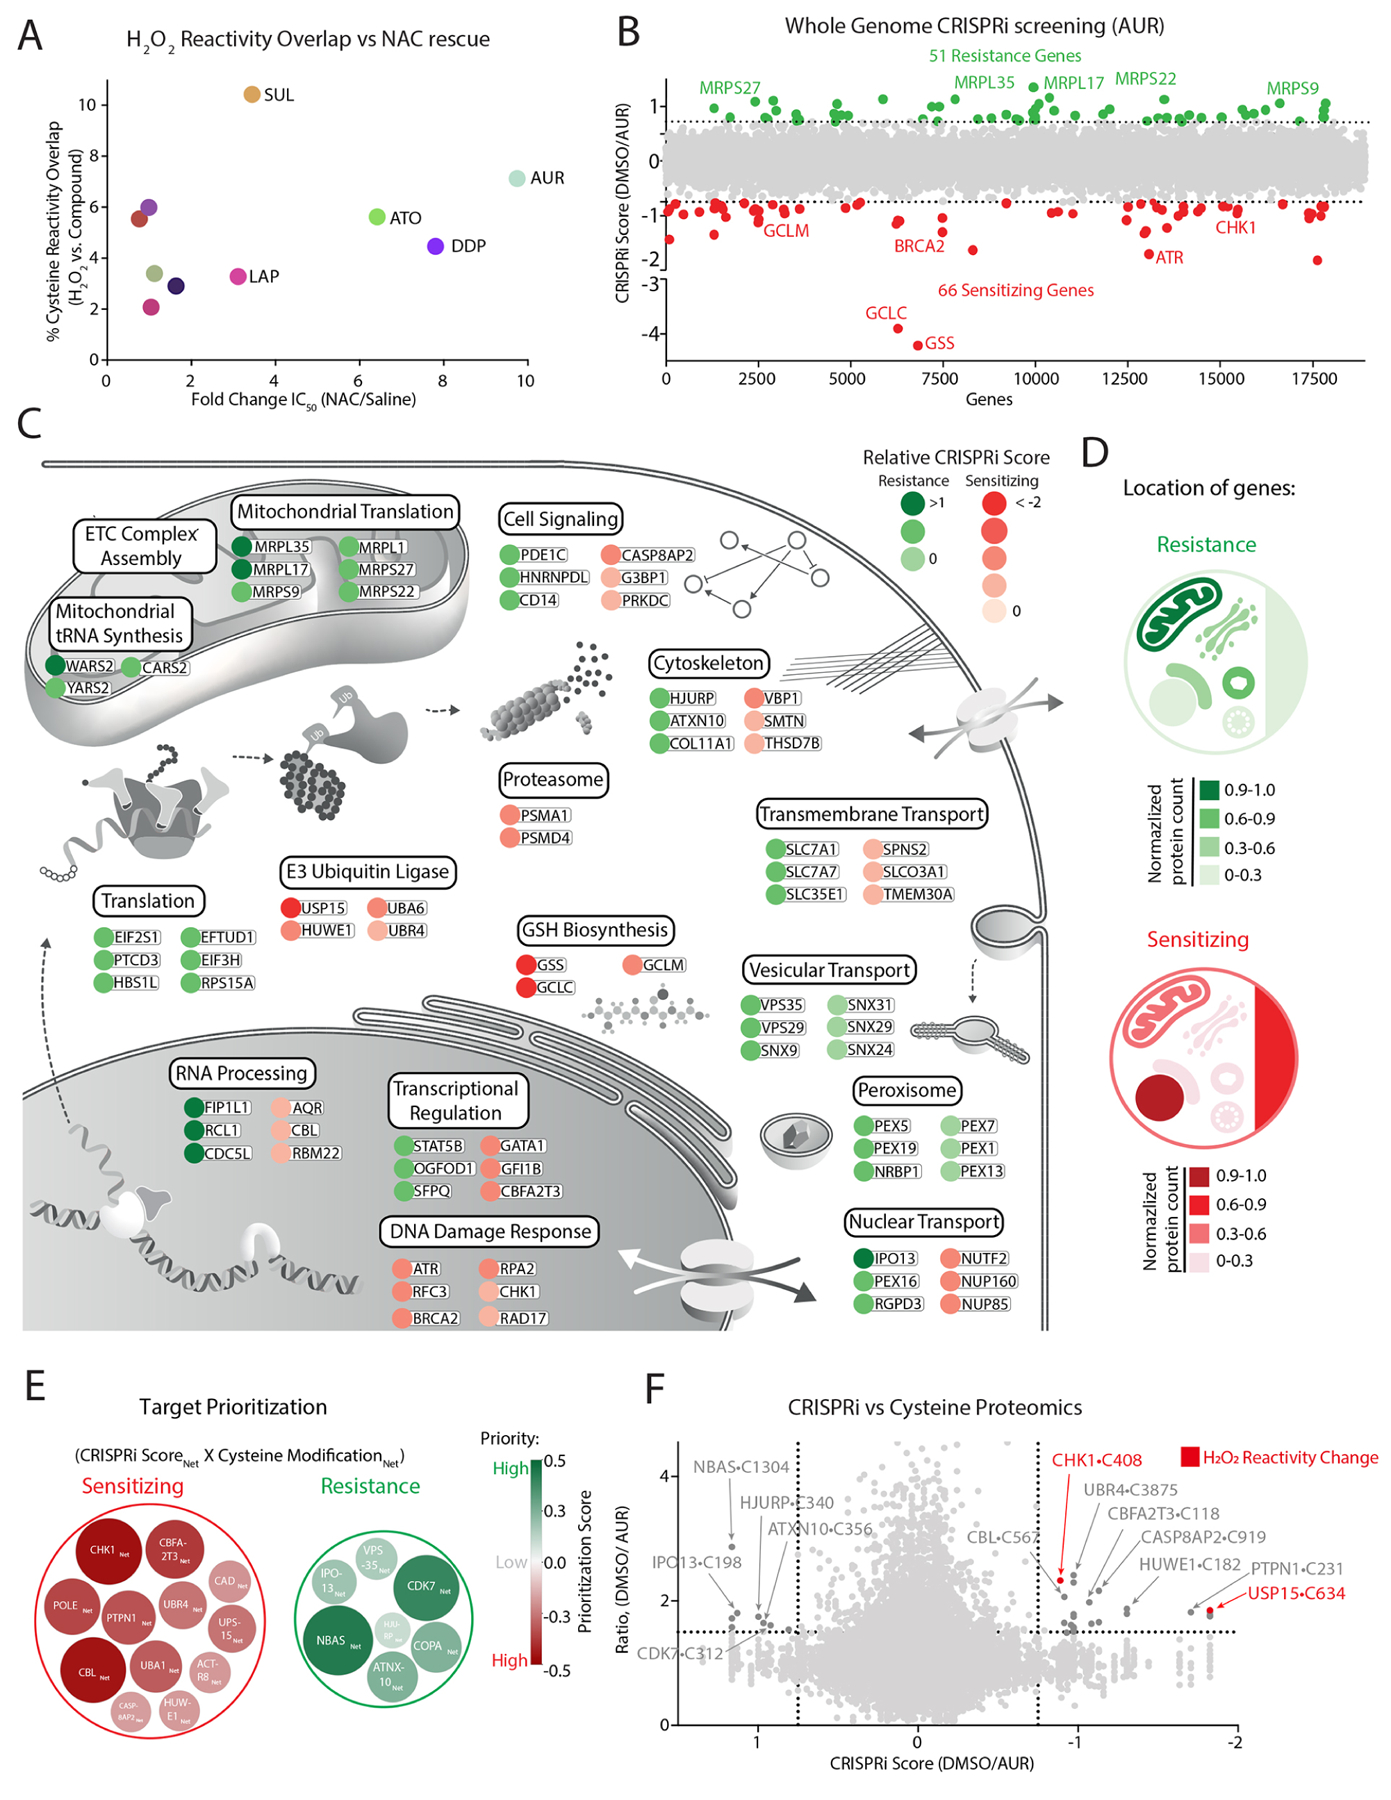
Figure 2: Functional genomic characterization of AUR-sensitizing and resistance pathways.

(A) Comparison of each agent’s overlap with H2O2 cysteine reactivity and fold-change in IC50 following NAC treatment (see also Figure S1C, Table S2A–B). (B) Genome-wide CRISPRi screen in K562 cells identifies genes that mediate sensitivity and resistance to AUR (see also Table S4). (C-D) Summary of top-scoring genes and corresponding pathways (C) and their cellular location (D) that promote resistance or sensitivity to AUR treatment. (E-F) Prioritization scheme for selecting targets (E) based on comparing their CRISPRi score and cysteine reactivity following AUR and H2O2 treatments (F) (see also methods, Tables S2–5).
