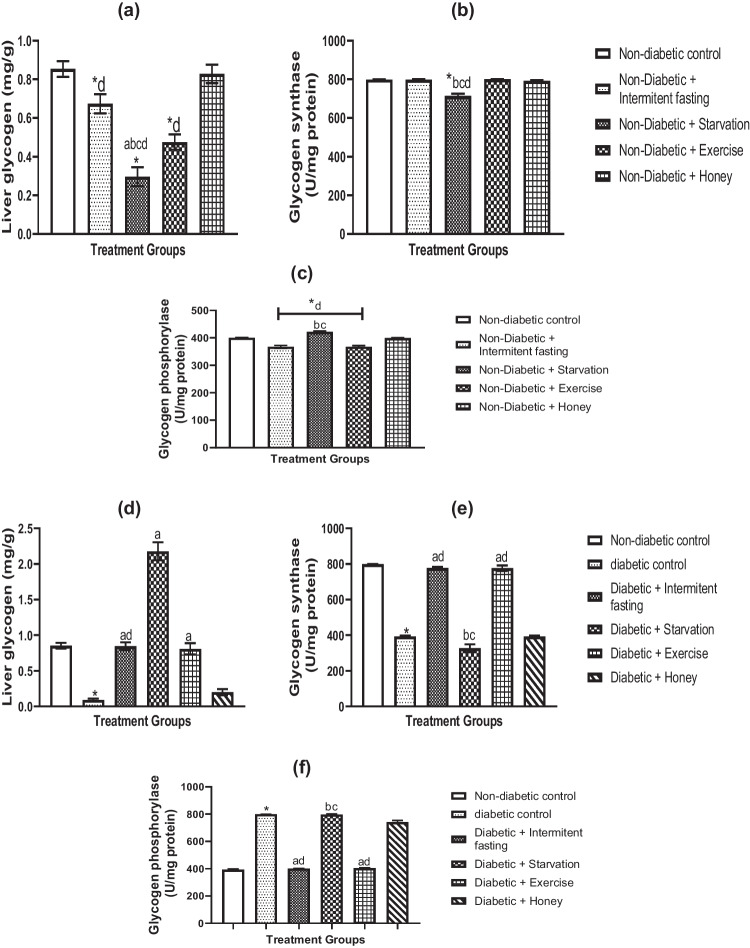
Fig. 1.
Effects of IF, starvation, exercise and honey on liver glycogen (a, d), glycogen synthase (b, e) and glycogen phosphorylase (c, f) activities in naïve and diabetic male Wistar rats. Bars show the Mean and S.E.M. (n = 6) data. *P less than 0.05 in comparison to the control group; ap less than 0.05 in comparison to the diabetes group; bp less than 0.05 in relation to the intermittent fasting group; cp less than 0.05 in relation to the exercise group; dp less than 0.05 in relation to the honey group

