

Abstract
Objectives:
This study examines the relationship between post-traumatic stress and loneliness and whether this relationship varies by perceived everyday discrimination among older Puerto Ricans.
Methods:
A total of 304 Puerto Ricans aged 60 and above from Wave 3 of the Boston Puerto Rican Health Study were included. Ordinary least squares regression examined the association between post-traumatic stress, perceived everyday discrimination, and loneliness.
Results:
Post-traumatic stress was significantly associated with a higher level of loneliness (β = 0.282; p < 0.001; 95% CI: 0.142, 0.423). The interaction effect between post-traumatic stress and perceived everyday discrimination on loneliness was statistically significant (β = 0.083; p < 0.05; 95% CI: 0.062, 0.230). More specifically, the positive association between post-traumatic stress and loneliness becomesmore robust with the increase in perceived everyday discrimination.
Conclusion:
Given an increase in population size on the U.S. mainland and migration from Puerto Rico due to natural disasters anddeclining economic conditions, it is essential to better understand the effect of perceived discrimination against older Puerto Ricans on the mainland United States as well as those who immigrated and stayed through older age. Outreach strategies and interventions that address perceived discrimination can helpmitigateloneliness among older Puerto Ricans who experienced trauma.
Keywords: post-traumatic stress, discrimination, loneliness, Puerto Ricans
Introduction
Lonelinessis a growing epidemic among older adults in the United States. It refers to the subjective feeling of being alone, separated, or isolated from others (Ernst & Cacioppo, 1999). Approximately 25–29%of older adults in the U.S. feel lonely(Ong et al., 2016; U.S. Health Resources & Services Administration, 2019). The prevalence rate of loneliness among older Puerto Ricans is 32.2%, much higher than for older Americans in general(Gao et al., 2021). Loneliness is a critical risk factor for older adults’ psychological well-being, physical health,and mortality. Research shows that loneliness is associated with compromisedpsychosocial wellness, such as isolation, low self-esteem, and feelings of hopelessness(Badcock et al., 2020; J. Wang et al., 2018; K. Wang et al., 2021). Furthermore, loneliness also negativelyaffects physical health,including but not limited to increased risks for cardiovascular diseases and morbidity (del Pozo Cruz et al., 2021; Valtorta et al., 2018).Notably, a meta-analysis found that loneliness and social isolation increased the likelihood of mortality by 26–32%(Holt-Lunstad et al., 2010), indicating a strong relationship between loneliness and older adults’ physical health. Older Latinos, including Puerto Ricans, may encounter unique cumulative stressors rooted in Latino culture. The concept of familismo is complex with various definitions (Ruiz & Ransford, 2012). The essence of the idea is an “intergenerational solidarity, obligation, respect and duty to care for one’s own” (Ruiz & Ransford, 2012). Due to shifts in generational expectations, changes in gender roles, and more geographically dispersed locations of family members, older Latinos, mainly immigrant women, maybe, unexpectedly,living alone with small support networks (Rote et al., 2021; Ruiz & Ransford, 2012).
When considering factors that contribute to older adults’ loneliness, post-traumatic stress is a significant variable for investigation. Theoretically, symptoms of post-traumatic stress, such as irritability, angry outburst, or aggressive behavior, negatively affect anindividual’ssocial-relational support, often resulting in elevated levels of loneliness. For example, Clapp and Beck(2009)found that greater PTSD severity was associated with greater negative attitudes about utilizing social support, which in turn was associated with less perceived support. Given the known association between social support and loneliness(Stephens et al., 2011; J. Wang et al., 2018), it isreasonable to anticipateincreased loneliness among those with greater PTSD symptoms. Similarly, Thompson and colleagues(Thompson et al., 2018) found that individuals with post-traumatic stress commonly experience social withdrawal and relational difficulties, leaving them with higher levels of loneliness. With evidence suggesting the bi-directional relationship between post-traumatic stress and loneliness, increased loneliness may further worsen symptoms of post-traumatic stress, causing a downward spiral in older adults’ physical and psychosocial wellbeing(Deprince et al., 2011; Fox et al., 2021).
Understanding the strong association between perceived social support and loneliness, this study focuses on loneliness for twocritical considerations. First, though not conclusive, social support has been primarily conceptualized as a contributor to individuals’ feelings of loneliness versus the other way around(Hombrados-Mendieta et al., 2013; S. Zhang et al., 2018; X. Zhang & Dong, 2022). For example, Solomon and colleagues(2014) found thatthe baseline level of social support predicted the longitudinal trajectory of change in loneliness. Second, loneliness is primarily a subjective state of feeling, whereas social support includes both an individual’s personal perception and the actual support available(Gottlieb & Bergen, 2010).Therefore,compared to social support, loneliness is more malleable to mental health interventions and social services, which makes it calls for more clinical and public health attention (Newall et al., 2014).
Puerto Ricans experience a significantly greater prevalence of post-traumatic stress-related symptoms and disorders (PTSS/D) than non-Hispanic white and all other Hispanic ethnic groups except for Dominicans(Adams & Boscarino, 2005; Galea et al., 2004; Vera et al., 2013). This places Puerto Ricans at a higher risk of loneliness and negative psychosocial and health consequences than other ethnic groups(Gao et al., 2021; García et al., 2020; Perreira et al., 2015)(Perreira et al., 2015). Therefore, it is essential to evaluate the association between post-traumatic stress and loneliness among older Puerto Ricans.
A critical yet understudied factor that affects the association between post-traumatic stress and loneliness among older Puerto Ricans is their experience of discrimination. Puerto Ricans present a unique set of experiences resulting from the history of the Archipelago nation, its political status vis a vis the United States, and the version of citizenship granted them in the early 20th century(Todorova et al., 2010). DespiteU.S. citizenship sincethe early 20th century, Puerto Ricans have a higher proportion (81%) that report experiencing discrimination than do Mexicans (68%) and Cubans (46%)(Almeida et al., 2016). The experience of discrimination against Puerto Ricans is associated with acculturation, skin color, education level, income, and anti-immigration policies(Todorova et al., 2010). Studies have reported that the experience of discrimination exacerbates older adults’ psychiatric symptoms, such as depression, aggression, and irritation, many of which are commonly seen among individuals with post-traumatic stress (Hirschtick et al., 2020; Salas-Wright et al., 2019).
Consequently, it is reasonable to expect that the negative impact of post-traumatic stress on loneliness among older Puerto Ricans is likely to be more pronounced among those who experience higher levels of discrimination, i.e., the experience of discrimination as a moderator. Nonetheless, the moderating effect of discrimination on post-traumatic stress and loneliness has not been investigated among older Puerto Ricans despite their higher risks of discrimination and loneliness than their non-Hispanic White counterparts. To address the research gap above, this study aims toexamine the association between post-traumatic stress and loneliness and whether that association varies by the level of perception of discrimination among older Puerto Ricans.
Methods
Participants and data source
We used data from the Boston Puerto Rican Health Study (BPRHS). BPRHS is a longitudinal study that examines social determinants of stress, health behaviors, and health outcomes among Puerto Ricans aged at least 45 years old living in the Boston, Massachusetts Metro area(Tucker et al., 2010). The 2000 U.S. Census data was used to identify neighborhood areas with at least 25 Puerto Rican residents.Then the research team randomly selected and enumerated blocks with at least 10 Puerto Ricans door-to-door within those neighborhood areas. Furthermore, the research teamrandomly recruited participantsat community events and festivals through a radio or TV announcement or via referral. The eligibility criteria included (1) self-identified as being of Puerto Rican descent, (2) aged at least 45 years old, (3) being able to speak either English or Spanish, and (4) currently residing in the Greater Boston metropolitan area. The response rate for BPRHS was high (83.7%). After participants offered written informed consent, trained bilingual interviewers administered the structured questionnaires and tests in the participants’ homes.
The BRPHS study has a total of three waves. However, we only employed the data from Wave 3 (collected from June 2011 to July 2015) because Wave 3 was the first and the only wave to include data on post-traumatic stress, everyday perceived discrimination, and loneliness.The total number of participants in Wave 3 was 882.As the target population for this study is Puerto Ricans aged 60 or above, we removed 320 subjects aged below 60. Among the remaining 562participants, we further removed 238 participants who did not report they experienced any of the 20 traumatic events based on the 1996 Detroit Area Survey of Trauma. The 20 traumatic eventsfall into the four categories: (1) assaultive violence (e.g., raped, shot or stabbed, or badly beaten up), (2) injury or shocking experience (e.g., natural disaster, diagnosed with a life-threatening disease, or vehicle crash), (3) learning about traumas to others (e.g., learning that friend/relative was sexually assaulted, physically attacked, or injured in vehicle crash), and (4) sudden death of a close friend/relative(Breslau et al., 1998).Therefore, the final analytic sample consisted of 304 Puerto Ricans aged at least 60 living in the Boston metro area and havingexperienced at least one traumatic event.
Measures
Loneliness
The dependent variable of this study is loneliness, which was assessed by the three-item Short Scale of Loneliness (Hughes et al., 2004).Participants were asked about how frequently they felt (1) lacking companionship, (2) left out, and (3) isolated from others. Responses for each item included: hardly ever/never (coded as 1), some of the time (coded as 2), and often (coded as 3). The level of loneliness was calculated as the sum of the three responses and had a theoretical range from three to nine(Cronbach’s α=0.732). A higher score indicates a higher level of loneliness.
Post-traumatic stress
The primary independent variable of this study is post-traumatic stress, which was assessed by 17 items from the Post-traumatic Stress Diagnostic Scale (PDS) (Foa, 1995). Participants were asked about how frequently there were bothered by the 17 items over the past month. Examples of the items included “reliving the traumatic events, acting, or feeling as if they were happening again,” “trying not to think about, talk about, or have feelings about the traumatic events,” and “feeling irritable or having fits of anger.”Responses for each item included: not at all/only one time (coded as 0), once in a while/once a week or less (coded as 1), about half the time/2–4 times a week (coded as 2), and almost always/5 or more times a week (coded as 3). The level of post-traumatic stress was generated based on the sum of all 17 responses. Thus, the possible range of the score was from 0 to 51, with a higher score representing a higher level of post-traumatic stress (Cronbach’s α=0.954).
Everyday perceived discrimination
Everyday perceived discrimination was measured by the Everyday Experiences of Discrimination Scale (Williams et al., 2016). Participants were asked how often they have experienced discriminatory events in their day-to-day lives over the past year. The scale had nine items in total, examples of which were “How often have people criticized your accent or the way you speak?”, “How often have people acted as if they think you are not smart?” and “How often have people acted as if they are better than you are?” Responses included never (coded as 0), rarely (coded as 1), sometimes (coded as 2), and often (coded as 3). We used the mean of all responses to quantify everyday perceived discrimination, with a higher score indicating a higher level of everyday perceived discrimination. The scale had a possible range of 0–3 (Cronbach’s α = 0.860).
Other covariates.
We used the Model of Depression and Loneliness (MODEL) framework to select the other covariates to control for this study(Cohen-Mansfield & Parpura-Gill, 2007). According to the MODEL framework, loneliness can also be influenced by environmental factors and resources (e.g., opportunitiesfor social contacts and financial resources), health (e.g., self-rated health and mobility difficulties), psychological barriers (e.g., psychological factors that influence social interactions), and stressful life events (e.g., types of traumatic events). In this study, environmental factors and resources included marital status (married with a spouse in household coded as the reference; married with a spouse, not in the home, divorced/separated, widowed, and never married,all coded as dummy variables), living with child (not living with child coded as the reference; living with child coded as a dummy variable), income (the ratio of household income to the household size-adjusted federal poverty level), and employment status (not working coded as the reference; working coded as a dummy variable). Health factors included self-rated health (poor coded as the reference; fair, good, very good, and excellent coded as dummy variables) and the Activities of Daily Living (ADL)scale. ADL mobility limitation was measured by five mobility-related items from the Katz ADL scale (Katz, 1983). Participants were asked how difficult these activities are for them to do by themselves without the use of special equipment: (1) walking for a quarter of a mile,(2) walking up ten steps without resting, (3) getting outside, (4) walking from one room to another on the same level, and (5) getting out of bed or chairs. Responses included with no difficulty (coded as 0), with some difficulty (coded as 1), with a lot of difficulties (coded as 2), and impossible to do (coded as 3). ADL mobility limitation score was calculated as the sum of all responses. The possible range of the score ranged from 0 to 15, with a higher score indicating a higher level of mobility limitation(Cronbach’s α = 0.792). Psychological factors included psychological acculturation score and years lived in the U.S.Psychological acculturation was measured by the Psychological Acculturation Scale. This 10-item instrument assesses an individual’s sense of psychological attachment to and belonging within the Hispanic or Anglo-American culture(Tropp et al., 1999). Examples of these items include “With which group of people do you feel you have the most in common?”, “Which group of people best understands your ideas?” and “Which culture do you know the most about?”. Responses included“only with Puerto Ricans” (coded as 1), “more with Puerto Ricans than Americans” (coded as 2), “same among Puerto Ricans and Americans” (coded as 3), “more with Americans than Puerto Ricans” (coded as 4), and “only with Americans” (coded as 5). Psychological acculturation was calculated as the sum of the ten responses and had a possible range of 10–50, with a higher score indicating a higher level of psychological acculturation (Cronbach’s α=0.967).For stressful events, we controlled for the total number of types of trauma experienced based onthe 20 types of traumatic events in the 1996 Detroit Area Survey of Trauma(Breslau et al., 1998). Finally, we also controlled for participants’ age, sex (male coded as 0 and female coded as 1), and education (“below 9th grade” coded as reference; “9th – 12th grade or GED” and “above high school” coded as dummy variables).
Statistical analysis
Descriptive statistics, including (1) means and standard deviations for continuous variables and (2) percentages for categorical variables, were used to summarize the participants’ characteristics. Two ordinary least squares (OLS)regression models examined the association between post-traumatic stress, everyday perceived discrimination, and loneliness. Model 1 was estimated to examine the main effects of post-traumatic stress and everyday perceived discrimination on loneliness after controlling for covariates. Model 2 added the interaction term between post-traumatic stress and everyday perceived discrimination to Model 1 and examined the moderation effect of everyday perceived discrimination on the association between post-traumatic stress and loneliness. We also conducted posthoc analyses based on Model 2 to examine the association between post-traumatic stress and loneliness for participants who experienceda wide possible range(intervals of 0.5 standard deviation) of everyday perceived discrimination (i.e., −1.5, −1.0, −0.5, 0, 0.5, 1, and 1.5 standard deviations away from the mean of everyday perceived discrimination). Based on results from Model 2,the conditional marginal effect of post-traumatic stress on loneliness (i.e., the first derivative of loneliness concerning post-traumatic stress) was estimated at all above-mentioned values of everyday perceived discrimination. Finally, we created a graph for the margins (i.e., predicted mean of loneliness) by post-traumatic stress for the values mentioned above of everyday perceived discrimination to further illustrate the margins effect of post-traumatic stress on loneliness. We tested the assumption of missing values at random (MCAR) with Little’s MCAR tests for both models. Results rejected the MCAR assumption (Model 1: χ2=163.515, p<0.05; Model 2: χ2=170.829, p<0.05). Therefore, we created 20 sets of multiply imputed data with multiple imputations by chained equations (MICE) approach to address potential biases caused by missing data (Royston & White, 2011). The parameters from the OLS regression models were calculated from the pooled results from the 20 imputed data sets. It is also worth mentioning that we standardized all regression coefficients (β) to demonstrate the effect sizes of all predictors. We used STATA SE 15 to perform all the data analyses.
Results
Descriptive Statistics
Table 1 shows descriptive statistics for the participants. To highlight a few, the means of post-traumatic stress, everyday perceived discrimination, and loneliness were 6.287 (SD = 10.046), 0.234 (SD = 0.456), and 4.963 (SD = 1.754), respectively. Over three-quarters (77.3%) of the participants were female. This may be partly because (1) women were more likely to have experienced traumatic events, especially physical or sexual assaults, and (2) men may be less likely to reveal traumatic experiences. More than half (53.5%)of the participants had education below 9th grade. It is worth noting that less than 10% of the total participants rated their general health as excellent (3.6%) or very good (6.3%).The sum of types of traumatic events experienced averaged at 2.625 (SD = 2.962). Table 2 shows the frequencies and percentages of experiencing each of the 20 types of traumatic events respectively. The percentages ranged from 2.4% (having been held captive, tortured, or kidnapped) to 42.8% (having experienced the sudden, unexpected death of a close friend or relative).
Table 1.
Descriptive statistics of the participants (N = 304)
| Variables | Mean (SD) | Percentage | N(missing) | |
|---|---|---|---|---|
|
| ||||
| Age | 67.533 | (5.541) | 0 | |
| Sex | 0 | |||
| Male | 22.7% | |||
| Female | 77.3% | |||
| Education | 1 | |||
| Below 9th grade | 53.3% | |||
| 9th – 12th grade or GED | 31.2% | |||
| Above high school | 15.5% | |||
| Marital status | 2 | |||
| Married, spouse in household | 24.2% | |||
| Married, spouse not in household | 5.0% | |||
| Divorced/separated | 34.1% | |||
| Widowed | 22.5% | |||
| Never married | 14.2% | |||
| Living with a child | 15.8% | 1 | ||
| Working | 8.9% | 0 | ||
| Household income in federal poverty ratio | 1.108 | (0.902) | 35 | |
| Self-rated health | 0 | |||
| Excellent | 3.6% | |||
| Very good | 6.3% | |||
| Good | 21.7% | |||
| Fair | 58.5% | |||
| Poor | 9.9% | |||
| ADL mobility limitation | 3.632 | (3.481) | 0 | |
| Psychological acculturation | 15.368 | (7.904) | 0 | |
| Years lived in the U.S. | 41.917 | (12.206) | 8 | |
| Sum of types of traumas experienced | 2.625 | (2.962) | ||
| Everyday perceived discrimination | 0.234 | (0.456) | 0 | |
| Post-traumatic stress | 6.287 | (10.046) | 0 | |
| Loneliness | 4.963 | (1.754) | 5 | |
Note: Percentages of whether experiencing 20 types of traumatic events were omitted, which ranged from 2.4% (having been held captive, tortured, or kidnapped) to 42.8% (having experienced the sudden, unexpected death of a close friend or relative).
Table 2.
Percentages of experiencing each of the 20 types of traumatic events (N = 304)
| Type of traumatic event | Frequency (N) | Percentage (%) |
|---|---|---|
|
| ||
| Experienced combat or exposure to a war zone in the military or as a civilian | 9 | 3.1% |
| Been raped | 30 | 10.2% |
| Experienced another kind of sexual assault or unwanted sexual contact as a result of force, threat of harm, or manipulation | 23 | 7.9% |
| Been shot or stabbed | 18 | 6.2% |
| Been held captive, tortured, or kidnapped | 7 | 2.4% |
| Been mugged, held up, or threatened with a weapon | 37 | 12.6% |
| Been badly beaten up | 50 | 16.9% |
| Been in a serious car or motor vehicle crash | 63 | 21.3% |
| Experienced any other kind of serious accident or injury | 36 | 12.2% |
| Experienced a natural disaster in which you were hurt or your property was damaged | 48 | 16.2% |
| Been diagnosed with a life-threatening illness or had a serious operation | 69 | 23.2% |
| Had a child of yours diagnosed as having a life-threatening illness | 41 | 13.9% |
| Witnessed someone being killed or seriously injured | 33 | 11.2% |
| Unexpectedly discovered a dead body | 40 | 13.5% |
| Learned that a close friend or relative was raped or sexually assaulted | 29 | 9.8% |
| Learned that a close friend or relative was seriously physically attacked | 38 | 12.8% |
| Learned that a close friend or relative was seriously injured in a motor vehicle crash | 44 | 15.1% |
| Learned that a close friend or relative was seriously injured in any other accident | 32 | 11.0% |
| Experienced the sudden, unexpected death of a close friend or relative | 128 | 42.8% |
| Experienced any other extraordinarily stressful situation or event | 23 | 7.8% |
Association between post-traumatic stress, everyday perceived discrimination, and loneliness
Table 3 shows results from the OLS regression models. Results of Model 1 shows that both post-traumatic stress(β = 0.282; p<0.001; 95% CI: 0.142, 0.423) and everyday perceived discrimination (β = 0.166; p < 0.01; 95% CI: 0.040, 0.291) were positively associated with loneliness after controlling for covariates.
Table 3.
Standardized coefficients from ordinary least square regression models predicting loneliness among older Puerto Ricans aged 60–81 (N=304)
| Variables | Model 1a | Model 2b | ||
|---|---|---|---|---|
|
| ||||
| β | 95% CI | β | 95% CI | |
|
| ||||
| Post-traumatic stress | 0.282*** | (0.142, 0.423) | 0.256*** | (0.113, 0.398) |
| Everyday perceived discrimination | 0.166** | (0.040, 0.291) | 0.084 | (0.062, 0.230) |
| Post-traumatic stress × Everyday perceived discrimination | 0.083* | (0.005, 0.161) | ||
| Age | −0.034 | (−0.149, 0.080) | 0.031 | (−0.149, 0.082) |
| Female (reference: male) | 0.092 | (−0.172, 0.355) | 0.093 | (−0.169, 0.356) |
| Education (reference: below 9th grade) | ||||
| 9th – 12th grade or GED | 0.032 | (−0.206, 0.270) | 0.026 | (−0.210, 0.262) |
| Above high school | −0.291 | (−0.617, 0.035) | −0.306 | (−0.629, 0.019) |
| Marital status (reference: married, spouse in household) | ||||
| Married, spouse not in household | 0.181 | (−0.319, 0.680) | 0.200 | (−0.297, 0.697) |
| Divorced/separated | 0.365* | (0.085, 0.645) | 0.344* | (0.065, 0.623) |
| Widowed | 0.354* | (0.039, 0.668) | 0.362* | (0.049, 0.675) |
| Never married | 0.354* | (0.010, 0.697) | 0.356 | (−0.017, 0.668) |
| Living with a child | −0.156 | (−0.445, 0.132) | −0.115 | (−0.404, 0.174) |
| Working | 0.078 | (−0.344, 0.500) | 0.041 | (−0.379, 0.462) |
| Household income in federal poverty ratio | −0.096 | (−0.219, 0.026) | −0.076 | (−0.199, 0.047) |
| Self-rated health (reference: poor) | ||||
| Fair | −0.364 | (−0.750, 0.021) | −0.358 | (−0.741, 0.026) |
| Good | −0.675** | (−1.127, −0.222) | −0.679** | (−1.129, −0.229) |
| Very good | −0.618* | (−1.211, −0.025) | −0.643* | (−1.232, −0.054) |
| Excellent | −0.538 | (−1.206, 0.131) | −0.561 | (−1.223, 0.103) |
| ADL mobility limitation | −0.049 | (−0.170, 0.073) | −0.053 | (−0.174, 0.068) |
| Psychological acculturation | 0.018 | (−0.103, 0.140) | 0.011 | (−0.110, 0.132) |
| Years lived in the U.S. | −0.34 | (−0.148, 0.080) | −0.082 | (−0.188, 0.024) |
| Sum of types of traumatic events | 0.044 | (−0.030, 0.060) | 0.015 | (−0.030, 0.059) |
Note.
Model 1 is the main effect model; R2 = 0.292; adjusted R2 = 0.239.
Model 2 is the interaction effect model; R2 = 0.303; adjusted R2 = 0.248.
p< 0.05
p< 0.01
p< 0.001.
Results of Model 2 show that the interaction effect between post-traumatic stress and everyday perceived discrimination on loneliness was statistically significant (β = 0.083; p < 0.05; 95% CI: 0.062, 0.230)—meaning that the association between post-traumatic stress and loneliness differed by the level of everyday perceived discrimination.Building on the results from Model 2 in Table 3, Table 4 shows the post-estimation results of the association between post-traumatic stress and loneliness for seven levels of everyday perceived discrimination. After controlling for all covariates, higher post-traumatic stress was significantly associated with a higher level of loneliness. Nonetheless, this association became more robustwith an increase in everyday perceived discrimination. For instance, for those experiencing 1.5 standard deviations below the mean of everyday perceived discrimination, post-traumatic stress was not significantly associated with loneliness (β = 0.131; p = 0.199; 95% CI: −0.070, 0.332). For those experiencing 1.5 standard deviation abovethe mean of everyday perceived discrimination, one standard deviation increase in post-traumatic stress was significantly associated with an average of 0.380standard deviation increase in loneliness (p < 0.001; 95% CI: 0.214, 0.546), which was almost three times as large as the effect among those with 1.5 standard deviations below the mean of everyday perceived discrimination.
Table 4.
Association between Post-traumatic stress and loneliness by everyday perceived discrimination among older Puerto Ricans aged 60–81 (N=304)
| Everyday perceived discrimination | Association between post-traumatic stress and loneliness |
|
|---|---|---|
| β | 95% CI | |
|
| ||
| −1.5 | 0.131 | (−0.070, 0.332) |
| −1.0 | 0.173 | (−0.002, 0.348) |
| −0.5 | 0.214** | (0.060, 0.369) |
| 0 | 0.256*** | (0.113, 0.400) |
| 0.5 | 0.297*** | (0.157, 0.437) |
| 1 | 0.338*** | (0.190, 0.487) |
| 1.5 | 0.380*** | (0.214, 0.546) |
Note:
p< 0.05
p< 0.001.
Discussion
This study examined the association between post-traumatic stress and loneliness and how this relationshipwas affected by experiences of discrimination among older Puerto Ricans. The main findings show that post-traumatic stress is significantly associated with loneliness. Further, the results indicate that perceived discrimination aggravates the relationship between post-traumatic stress and loneliness. In other words, the association between post-traumatic stress and loneliness was stronger among those who experienceda higher level of discrimination than their counterparts who experienced a lower level of discrimination.These results confirm those within the literatureon other populationsregarding the relationship between post-traumatic stress and loneliness (Clapp & Gayle Beck, 2009; Thompson et al., 2018). Post-traumatic stress can lead to feelings of emptiness and loss of purpose in life, as those with PTSDencounter difficulties developing new relationships or maintaining existing support networks. Additionally, the findings add to the current knowledge byestablishing that perceived discrimination worsens the effect of post-traumatic stress on loneliness among those older Puerto Ricans.
For Puerto Ricans, cultural and sociopolitical factors can contribute to their experience of discrimination that affects loneliness.First, it is essential to note that the sample scored an average of about 15 out of a possible 50 on psychological acculturation, which suggeststhere maynot be a strong US cultural attachment among this population. More experiences of discrimination may strengthen cultural ties to their communities and lessen opportunities for social connectedness. Second, Puerto Ricans are U.S. citizens by birth, even when born in Puerto Rico territory, which may seemingly be an advantage over other immigrant Latino groupsabout facing less discrimination in the United States. However, citizenship does not shield Puerto Ricans from being treated as second-class citizens. Social markers such as cultural, class, racial differences, and language use are potentfactors that place Puerto Ricans closer to other Latino groups. Still, the higher reporting of experiences of discrimination relative to other Latino groups is puzzlingand needs to be pursued further. Because they have been citizens since birth, Puerto Ricans may perceive discrimination differently from other Latino groups.
The heightened effect of PTSD on feelings of loneliness among those who experience higher perceived discrimination suggests a moderation effect needing further attention. This findingcan be especially relevant in the context of the lonelinessstemming from reduced social support. Perceived discrimination can have the potential to reduce the awareness of sources of support further, individually, familywise, or through organizations—exacerbating theirdiminished social support network due to PTSD. In this sample of participants who experiencedtraumatic events, only a quarter reported living with a spouse, and about a sixth said living with a child, suggesting a small immediate support network. We notice that results showed older adults divorced or widowed may have been particularly vulnerable,having experienced a potentially traumatic event through their separation or loss that could have increased loneliness, which is consistent with previous literature on familismo, discrimination, and loneliness among Latino Americans (Ayón et al., 2010; Calzada et al., 2012; Garcini et al., 2019). Still, more research is needed to examine the family support availability and expectations (i.e., familismo) in affecting the dynamics of PTSD, perceived discrimination, and loneliness in Puerto Rican communities and inform the interventions that are culturally appropriate to address the mental health needs among this population, especially in bereavement. Finally, most of the sample’s level of education and poverty ratio were low, so they may livein low-income neighborhoods, wherethe potential for neighborhood violence may be higher(Alloush & Bloem, 2022; Kravitz-Wirtz et al., 2022; Santacrose et al., 2021). Further research is needed to investigate the issue of neighborhood violence, which may be a factor contributing to the isolation of older adults whose safety fears may outweigh seeking support. This last point can be especially relevant to those who have experienced post-traumatic stress due to violent acts in their communities.
Several limitations should be acknowledged. We used cross-sectional data for this study, limiting the hypothesized relationships’ causal inference. For example, there are similarities between posttraumatic symptoms (i.e., biases associated with negative cognitions and feelings of threat) and descriptions of loneliness (i.e., being inherently focused and attentive toward potential social threat), whereby either could lead to the other (Fox et al., 2021). The Loneliness Loop, introduced by Hawkley and Cacioppo (2010), may explain this bi-directional relationship, whereby they posit that the perception of social isolation may lead a person to feel unsafe, an inclination for hyper vigilantly assessing one’s environment for threats, cognitive biases about a dangerous world, and then social isolation, which is subsequently blamed on the environment.Thus, future research that useslongitudinal data and covariates based on a framework that explains the bi-directional relationship between post-traumatic stress and loneliness is needed. Also, different dimensions of loneliness (e.g., emotional loneliness)need to be included in future studies, as the measure in this study focused on social loneliness.Furthermore, participants in this study aged between 60 and 81years old limit the generalizability of results to other Puerto Ricans living in the Boston area, especially nonagenarians and centenarians. In addition, as the study was conducted only in the Greater Boston Area, the findings may not apply to older Puerto Ricans in other parts of the U.S.
Conclusion
This study found that perceived discrimination can exacerbate feelings of loneliness for older Puerto Rican adults who have experienced post-traumatic stress. Having experienced post-traumatic stress is already an isolating experience due to stigma and other mental health issues resulting in loneliness. Experiencing discrimination by itself can be exhausting, but when combined with the effects of post-traumatic stress it can become even more isolating and lead to a more profoundsense of loneliness. Given an increase in population size and immigration from Puerto Rico due to natural disasters and poor economic conditions, it is essential to better understand the effect of perceived discrimination on older Puerto Ricans already in the United States and those who immigrate and stay through older age. Findings from this study call for the inclusion of outreach strategies and interventions that consider the effect of perceived discrimination to prevent older Puerto Ricans who have experienced post-traumatic stress from experiencing more profound loneliness.
Figure 1.
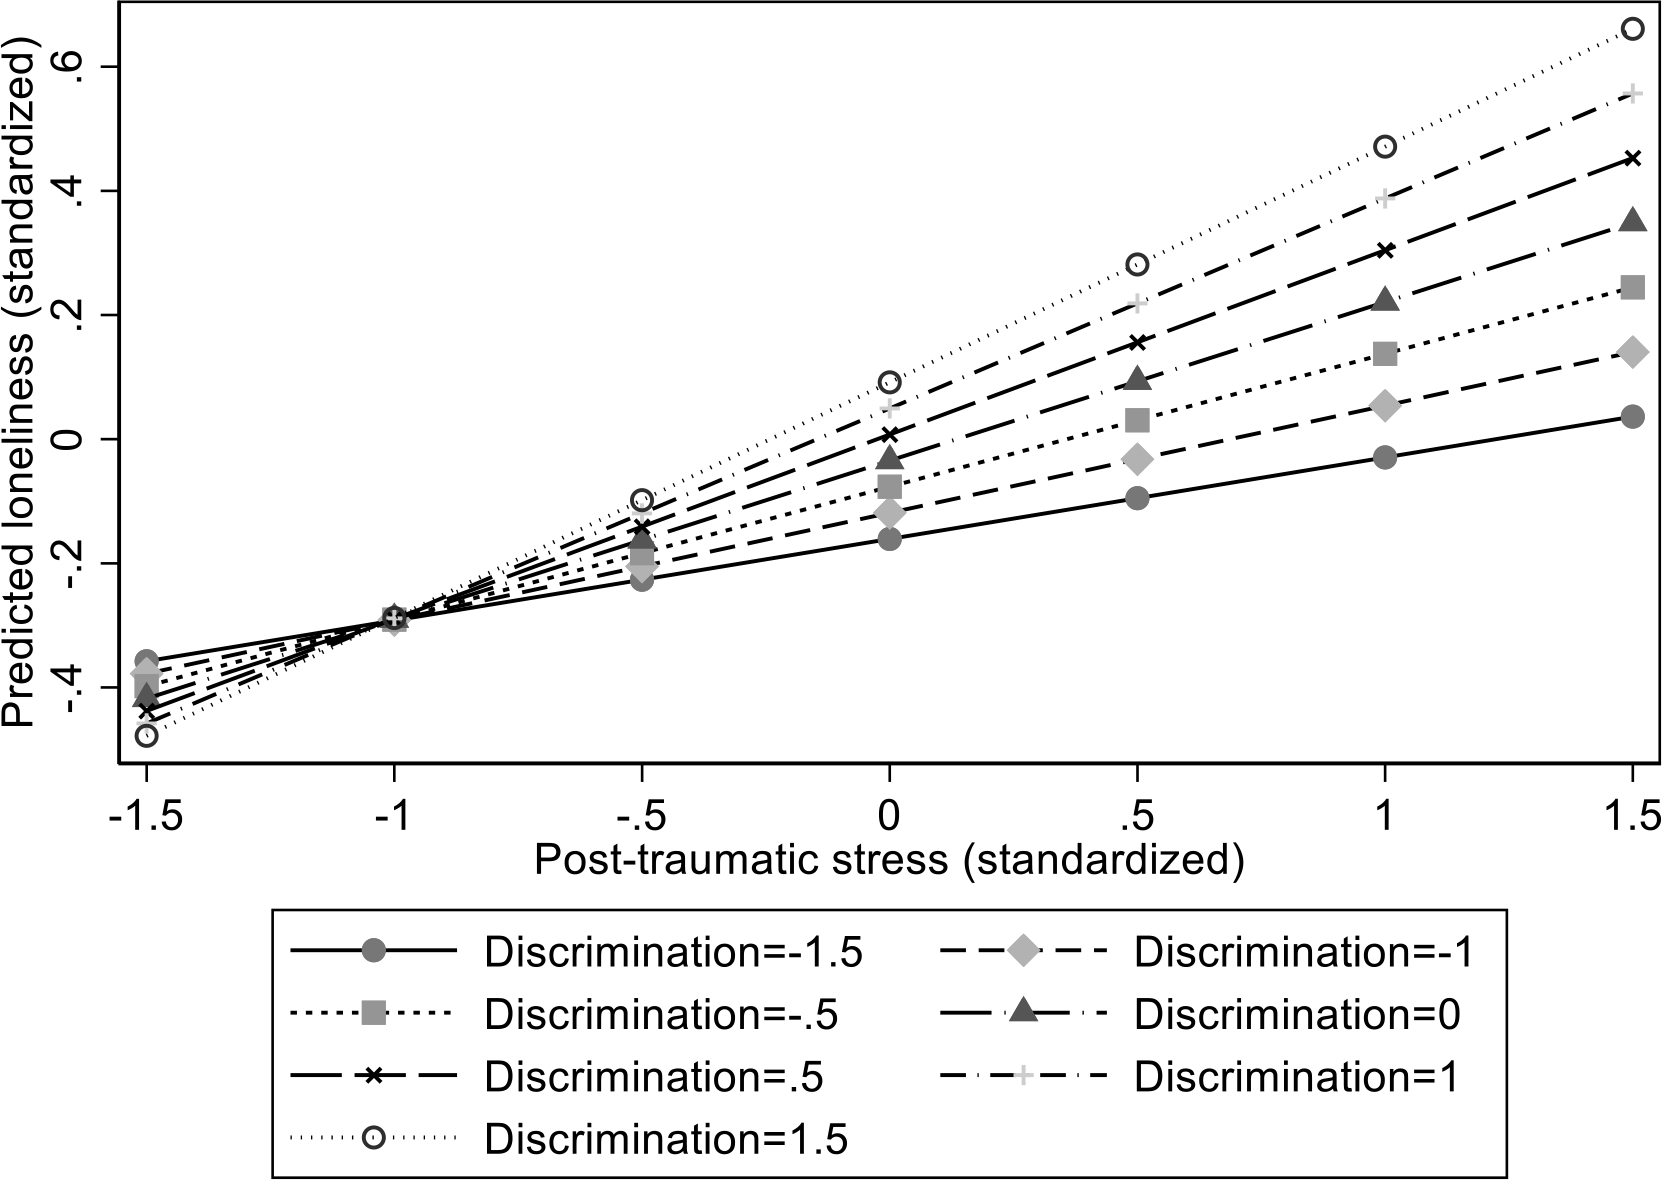
The association between predicted loneliness and post-traumatic stress by seven levels of everyday perceived discrimination
References
- Adams RE, & Boscarino JA (2005). Differences in mental health outcomes among whites, African Americans, and Hispanics following a community disaster. Psychiatry, 68(3), 250–265. 10.1521/psyc.2005.68.3.250 [DOI] [PMC free article] [PubMed] [Google Scholar]
- Alloush M, & Bloem JR (2022). Neighborhood violence, poverty, and psychological well-being. Journal of Development Economics, 154, 102756. 10.1016/J.JDEVECO.2021.102756 [DOI] [Google Scholar]
- Almeida J, Biello KB, Pedraza F, Wintner S, & Viruell-Fuentes E (2016). The association between anti-immigrant policies and perceived discrimination among Latinos in the US: A multilevel analysis. SSM - Population Health, 2, 897–903. 10.1016/J.SSMPH.2016.11.003 [DOI] [PMC free article] [PubMed] [Google Scholar]
- Ayón C, Marsiglia FF, & Bermudez-Parsai M (2010). Latino family mental health: Exploring the role of discrimination and familismo. Journal of Community Psychology, 38(6), 742–756. 10.1002/JCOP.20392 [DOI] [PMC free article] [PubMed] [Google Scholar]
- Badcock JC, Adery LH, & Park S (2020). Loneliness in psychosis: A practical review and critique for clinicians. Clinical Psychology: Science and Practice, 27(4). 10.1111/CPSP.12345 [DOI] [Google Scholar]
- Breslau N, Kessler RC, Chilcoat HD, Schultz LR, Davis GC, & Andreski P (1998). Trauma and posttraumatic stress disorder in the community: The 1996 Detroit Area Survey of Trauma. Archives of General Psychiatry, 55(7), 626–632. 10.1001/ARCHPSYC.55.7.626 [DOI] [PubMed] [Google Scholar]
- Calzada EJ, Tamis-LeMonda CS, & Yoshikawa H (2012). Familismo in Mexican and Dominican families from low-income, urban communities: Journal of Family Issues, 34(12), 1696–1724. 10.1177/0192513X12460218 [DOI] [Google Scholar]
- Clapp JD, & Gayle Beck J (2009). Understanding the relationship between PTSD and social support: The role of negative network orientation. Behaviour Research and Therapy, 47(3), 237–244. 10.1016/J.BRAT.2008.12.006 [DOI] [PMC free article] [PubMed] [Google Scholar]
- Cohen-Mansfield J, & Parpura-Gill A (2007). Loneliness in older persons: A theoretical model and empirical findings. International Psychogeriatrics, 19(2), 279–294. 10.1017/S1041610206004200 [DOI] [PubMed] [Google Scholar]
- del Pozo Cruz B, Perales F, Alfonso-Rosa RM, & del Pozo-Cruz J (2021). Impact of social isolation on physical functioning among older adults: A 9-Year Longitudinal Study of a U.S.-Representative Sample. American Journal of Preventive Medicine, 61(2), 158–164. 10.1016/J.AMEPRE.2021.02.003 [DOI] [PubMed] [Google Scholar]
- Deprince AP, Chu AT, & Pineda AS (2011). Links between specific posttrauma appraisals and three forms of trauma-related distress. Psychological Trauma: Theory, Research, Practice, and Policy, 3(4), 430–441. 10.1037/A0021576 [DOI] [Google Scholar]
- Ernst JM, & Cacioppo JT (1999). Lonely hearts: Psychological perspectives on loneliness. Applied and Preventive Psychology, 8(1), 1–22. 10.1016/S0962-1849(99)80008-0 [DOI] [Google Scholar]
- Foa EB (1995). PDS: Posttraumatic Stress Diagnostic Scale: Manual. Pearson. [Google Scholar]
- Fox R, McHugh Power J, Coogan AN, Beekman ATF, van Tilburg TG, & Hyland P (2021). Posttraumatic stress disorder and loneliness are associated over time: A longitudinal study on PTSD symptoms and loneliness, among older adults. Psychiatry Research, 299, 113846. 10.1016/J.PSYCHRES.2021.113846 [DOI] [PubMed] [Google Scholar]
- Galea S, Vlahov D, Tracy M, Hoover DR, Resnick H, & Kilpatrick D (2004). Hispanic ethnicity and post-traumatic stress disorder after a disaster: Evidence from a general population survey after September 11, 2001. Annals of Epidemiology, 14(8), 520–531. 10.1016/j.annepidem.2004.01.006 [DOI] [PubMed] [Google Scholar]
- Gao Q, Prina AM, Prince M, Acosta D, Luisa Sosa A, Guerra M, Huang Y, Jimenez-Velazquez IZ, Llibre Rodriguez JJ, Salas A, Williams JD, Liu Z, Acosta Castillo I, & Mayston R (2021). Loneliness among older adults in Latin America, China, and India: Prevalence, correlates and association with mortality. International Journal of Public Health, 66, 604449. 10.3389/IJPH.2021.604449/FULL [DOI] [PMC free article] [PubMed] [Google Scholar]
- García C, Sheehan CM, Flores-Gonzalez N, & Ailshire JA (2020). Sleep patterns among US Latinos by nativity and country of origin: Results from the National Health Interview Survey. Ethnicity & Disease, 30(1), 128. 10.18865/ED.30.1.119 [DOI] [PMC free article] [PubMed] [Google Scholar]
- Garcini LM, Brown RL, Chen MA, Saucedo L, Fite AM, Ye P, Ziauddin K, & Fagundes CP (2019). Bereavement among widowed Latinos in the United States: A systematic review of methodology and findings. Death Studies, 45(5), 342–353. 10.1080/07481187.2019.1648328 [DOI] [PMC free article] [PubMed] [Google Scholar]
- Gottlieb BH, & Bergen AE (2010). Social support concepts and measures. Journal of Psychosomatic Research, 69(5), 511–520. 10.1016/J.JPSYCHORES.2009.10.001 [DOI] [PubMed] [Google Scholar]
- Hawkley LC, & Cacioppo JT (2010). Loneliness matters: A theoretical and empirical review of consequences and mechanisms. Annals of Behavioral Medicine, 40(2), 218–227. 10.1007/S12160-010-9210-8 [DOI] [PMC free article] [PubMed] [Google Scholar]
- Hirschtick JL, Homan SM, Rauscher G, Rubin LH, Johnson TP, Peterson CE, & Persky VW (2020). Persistent and aggressive interactions with the police: Potential mental health implications. Epidemiology and Psychiatric Sciences, 29. 10.1017/S2045796019000015 [DOI] [PMC free article] [PubMed] [Google Scholar]
- Holt-Lunstad J, Smith TB, & Layton JB (2010). Social relationships and mortality risk: A meta-analytic review. PLOS Medicine, 7(7). 10.1371/JOURNAL.PMED.1000316 [DOI] [PMC free article] [PubMed] [Google Scholar]
- Hombrados-Mendieta I, García-Martín MA, & Gómez-Jacinto L (2013). The relationship between social support, loneliness, and subjective well-being in a Spanish sample from a multidimensional perspective. Social Indicators Research, 114(3), 1013–1034. 10.1007/S11205-012-0187-5/FIGURES/4 [DOI] [Google Scholar]
- Hughes ME, Waite LJ, Hawkley LC, & Cacioppo JT (2004). A short scale for measuring loneliness in large surveys: Results from two population-based studies. Research on Aging, 26(6), 655–672. 10.1177/0164027504268574 [DOI] [PMC free article] [PubMed] [Google Scholar]
- Katz S (1983). Assessing self-maintenance: Activities of daily living, mobility, and instrumental activities of daily living. Journal of the American Geriatrics Society, 31(12), 721–727. 10.1111/j.1532-5415.1983.tb03391.x [DOI] [PubMed] [Google Scholar]
- Kravitz-Wirtz N, Bruns A, Aubel AJ, Zhang X, Buggs SA, Kravitz-Wirtz N, Aubel AJ, Buggs SA, Bruns A, & Zhang X (2022). Inequities in community exposure to deadly gun violence by race/ethnicity, poverty, and neighborhood disadvantage among youth in large US cities. Journal of Urban Health, 1–16. 10.1007/S11524-022-00656-0 [DOI] [PMC free article] [PubMed] [Google Scholar]
- Newall NEG, Chipperfield JG, & Bailis DS (2014). Predicting stability and change in loneliness in later life. Journal of Social and Personal Relationships, 31(3), 351. 10.1177/0265407513494951 [DOI] [PMC free article] [PubMed] [Google Scholar]
- Ong AD, Uchino BN, & Wethington E (2016). Loneliness and health in older adults: A mini-review and synthesis. Gerontology, 62(4), 443–449. 10.1159/000441651 [DOI] [PMC free article] [PubMed] [Google Scholar]
- Perreira KM, Gotman N, Isasi CR, Arguelles W, Castañeda SF, Daviglus ML, Giachello AL, Gonzalez P, Penedo FJ, Salgado H, & Wassertheil-Smoller S (2015). Mental health and exposure to the United States: Key correlates from the Hispanic Community Health Study of Latinos. Journal of Nervous and Mental Disease, 203(9), 670–678. 10.1097/NMD.0000000000000350 [DOI] [PMC free article] [PubMed] [Google Scholar]
- Rote SM, Angel JL, Kim J, & Markides KS (2021). Dual trajectories of dementia and social support in the Mexican-origin population. The Gerontologist, 61(3), 374–382. 10.1093/GERONT/GNAA100 [DOI] [PMC free article] [PubMed] [Google Scholar]
- Royston P, & White IR (2011). Multiple Imputation by Chained Equations (MICE): Implementation in Stata. Journal of Statistical Software, 45(4), 1–20. [Google Scholar]
- Ruiz ME, & Ransford HE (2012). Latino elders reframing familismo: Implications for health and caregiving support. Journal of Cultural Diversity, 19(2), 50–57. [PubMed] [Google Scholar]
- Salas-Wright CP, Vaughn MG, Goings TC, Oh S, Delva J, Cohen M, & Schwartz SJ (2019). Trends and mental health correlates of discrimination among Latin American and Asian immigrants in the United States. Social Psychiatry and Psychiatric Epidemiology, 55(4), 477–486. 10.1007/S00127-019-01811-W [DOI] [PubMed] [Google Scholar]
- Santacrose DE, Kia-Keating M, & Lucio D (2021). A systematic review of socioecological factors, community violence exposure, and disparities for Latinx youth. Journal of Traumatic Stress, 34(5), 1027–1044. 10.1002/JTS.22733 [DOI] [PubMed] [Google Scholar]
- Solomon Z, Bensimon M, Greene T, Horesh D, & Ein-Dor T (2014). Loneliness trajectories: The role of posttraumatic symptoms and social support. Journal of Loss and Trauma, 20(1), 1–21. 10.1080/15325024.2013.815055 [DOI] [Google Scholar]
- Stephens C, Alpass F, Towers A, & Stevenson B (2011). The effects of types of social networks, perceived social support, and loneliness on the health of older people: Accounting for the social context. Journal of Aging and Health, 23(6), 887–911. 10.1177/0898264311400189 [DOI] [PubMed] [Google Scholar]
- Thompson NJ, Fiorillo D, Rothbaum BO, Ressler KJ, & Michopoulos V (2018). Coping strategies as mediators in relation to resilience and posttraumatic stress disorder. Journal of Affective Disorders, 225, 153–159. 10.1016/J.JAD.2017.08.049 [DOI] [PMC free article] [PubMed] [Google Scholar]
- Todorova ILG, Falcón LM, Lincoln AK, & Price LL (2010). Perceived discrimination, psychological distress and health. Sociology of Health & Illness, 32(6), 843–861. 10.1111/J.1467-9566.2010.01257.X [DOI] [PMC free article] [PubMed] [Google Scholar]
- Tropp LR, Erkut S, Coll CG, Alarcón O, & Vázquez García HA (1999). Psychological acculturation: Development of a new measure for Puerto Ricans on the U.S. mainland. Educational and Psychological Measurement, 59(2), 351–367. 10.1177/00131649921969794 [DOI] [PMC free article] [PubMed] [Google Scholar]
- Tucker KL, Mattei J, Noel SE, Collado BM, Mendez J, Nelson J, Griffith J, Ordovas JM, & Falcon LM (2010). The Boston Puerto Rican Health Study, a longitudinal cohort study on health disparities in Puerto Rican adults: Challenges and opportunities. BMC Public Health, 10(1), 1–12. 10.1186/1471-2458-10-107 [DOI] [PMC free article] [PubMed] [Google Scholar]
- U.S. Health Resources & Services Administration. (2019). The “Loneliness Epidemic.” https://www.hrsa.gov/enews/past-issues/2019/january-17/loneliness-epidemic
- Valtorta NK, Kanaan M, Gilbody S, & Hanratty B (2018). Loneliness, social isolation and risk of cardiovascular disease in the English Longitudinal Study of Ageing. European Journal of Preventive Cardiology, 25(13), 1387–1396. 10.1177/2047487318792696 [DOI] [PubMed] [Google Scholar]
- Vera M, Juarbe D, Hernández N, Obén A, Pérez-Pedrogo C, & Chaplin WF (2013). Probable posttraumatic stress disorder and psychiatric co-morbidity among Latino primary care patients in Puerto Rico. Journal of Depression & Anxiety, 01(05), 124. 10.4172/2167-1044.1000124 [DOI] [PMC free article] [PubMed] [Google Scholar]
- Wang J, Mann F, Lloyd-Evans B, Ma R, & Johnson S (2018). Associations between loneliness and perceived social support and outcomes of mental health problems: A systematic review. BMC Psychiatry, 18(1), 1–16. 10.1186/S12888-018-1736-5/TABLES/6 [DOI] [PMC free article] [PubMed] [Google Scholar]
- Wang K, Zhang A, Cuevas AG, De Fries CM, Hinton L, & Falcón LM (2021). The association between post-traumatic stress and depressive symptoms among older Puerto Ricans in Boston: How does loneliness matter? Journal of Aging and Health. 10.1177/08982643211064123 [DOI] [PubMed] [Google Scholar]
- Williams DR, Yu Y, Jackson JS, & Anderson NB (2016). Racial differences in physical and mental health: Socio-economic status, stress and discrimination. Journal of Health Psychology, 2(3), 335–351. 10.1177/135910539700200305 [DOI] [PubMed] [Google Scholar]
- Zhang S, Tian Y, Sui Y, Zhang D, Shi J, Wang P, Meng W, & Si Y (2018). Relationships between social support, loneliness, and internet addiction in Chinese postsecondary students: A longitudinal cross-lagged analysis. Frontiers in Psychology, 9, 1707. 10.3389/FPSYG.2018.01707/BIBTEX [DOI] [PMC free article] [PubMed] [Google Scholar]
- Zhang X, & Dong S (2022). The relationships between social support and loneliness: A meta-analysis and review. Acta Psychologica, 227, 103616. 10.1016/J.ACTPSY.2022.103616 [DOI] [PubMed] [Google Scholar]