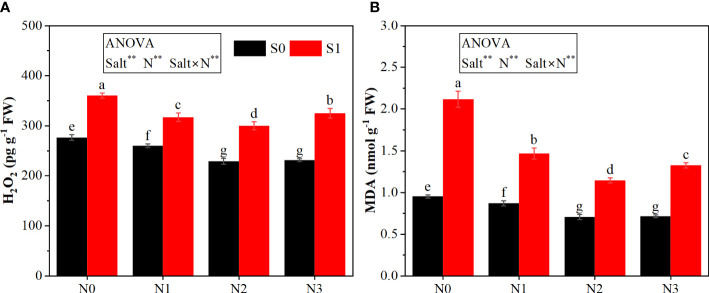
Figure 2.
Effects of salt stress on ROS accumulation in rapeseed seedlings under different N levels. (A) Hydrogen peroxide (H2O2) and (B) malondialdehyde (MDA). S0 and S1 respectively represent salinity levels of 0 and 3 g NaCl kg−1 soil. N0, N1, N2, and N3 respectively represent N rate levels of 0, 0.1, 0.2, and 0.3 g N kg−1 soil. Different letters indicate significant differences at p = 0.05. Probability level is indicated by ** for 0.01. FW, fresh weight.

