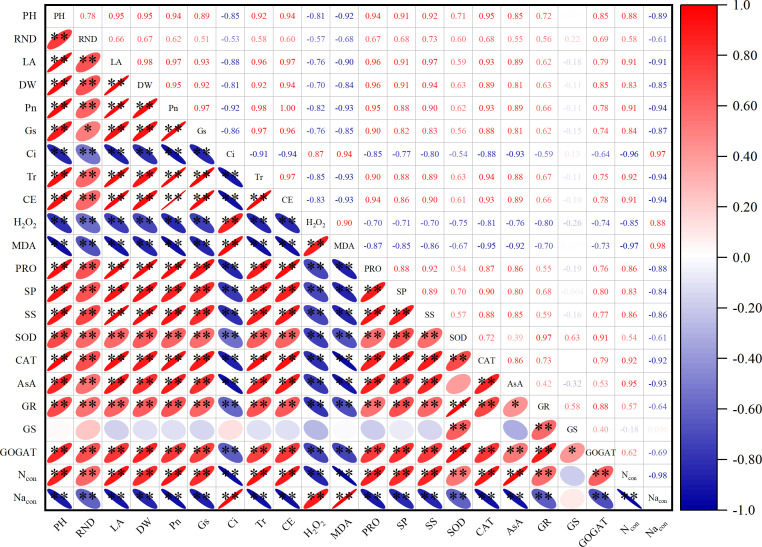
Figure 5.
Pearson’s correlation analysis of plant growth, ROS, photosynthesis, antioxidant, osmoregulation, and N metabolism under salt stress. PH, plant height; RND, root neck diameter; LA, leaf area; DW, dry weight; Pn, photosynthetic rate; Gs, stomatal conductance; Ci, intercellular CO2 concentration; Tr, transpiration rate; CE, instantaneous carboxylation efficiency; H2O2, hydrogen peroxide; MDA, malondialdehyde; PRO, proline; SP, soluble protein; SS, soluble sugar; SOD, superoxide dismutase; CAT, catalase; AsA, ascorbic acid; GR, glutathione reductase; GS, glutamine synthetase; GOGAT, glutamate synthase; Ncon, leaf N content; Nacon, leaf Na content; ROS, reactive oxygen species. Probability levels are indicated by * and ** for 0.05 and 0.01, respectively.

