Figure 1.
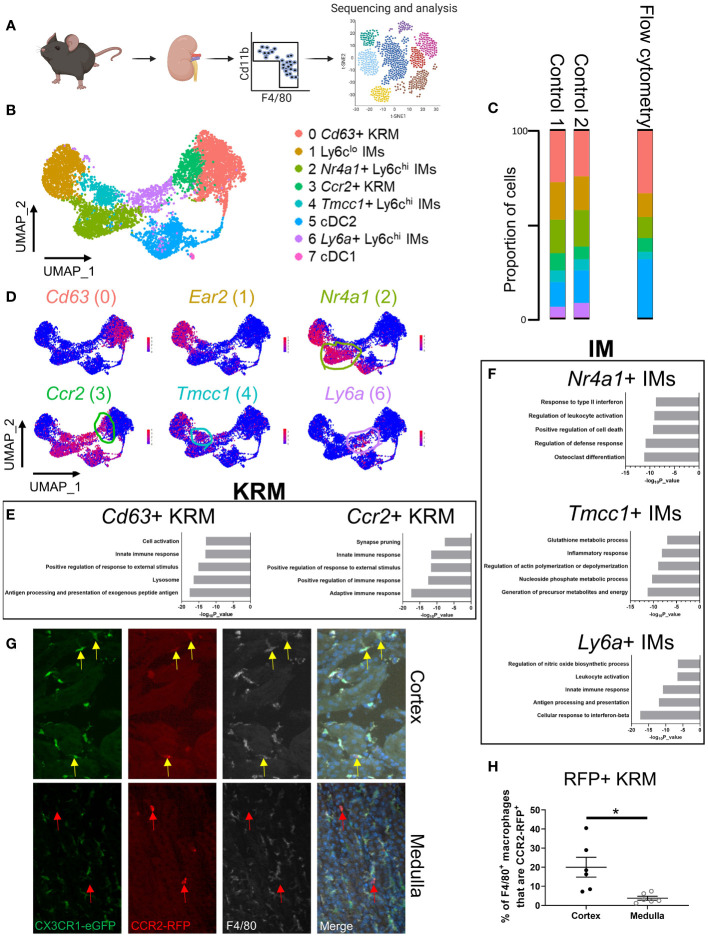
scRNAseq reveals the cellular diversity of monocytes and tissue resident macrophages in the kidney. (A) Schematic of the strategy used to perform scRNAseq on CD11b+ and F4/80+ immune cells isolated from control mice. The control mice for this study were littermates of the Cx3cr1 gfp/gfp knockout mice shown in Figure 3 . (B) UMAP of myeloid cells identified via single cell RNA sequencing. (C) Quantification of cluster abundance in scRNAseq and flow cytometry data. For flow cytometry, we used surrogate markers to identify Nr4a1+ IMs (UPAR), Tmcc1+ IMs (LRP1), and Ccr2+ KRM (Clec12a). N=5 mice. (D) Feature plot showing top DEGs in each cell cluster. (E, F) Metascape pathway analysis of genes that were significantly enriched (adjusted p value < 0.05) in (E) KRM or (F) IM subsets. (G) Representative confocal microscopy images of kidneys harvested from Ccr2 rfp/wt Cx3cr1 gfp/wt mice that were stained with a pan-macrophage marker, F4/80. Yellow arrows depict Ccr2+ KRM while red arrows depict Ccr2+ cells that lacked Cx3cr1 and F4/80 expression. Images from both the cortex and medulla are shown. Images were taken with a 20X objective. N=3 mice. (H) Quantification of RFP, F4/80 double positive macrophages in the cortex and medulla. T-test. *P< 0.05.

