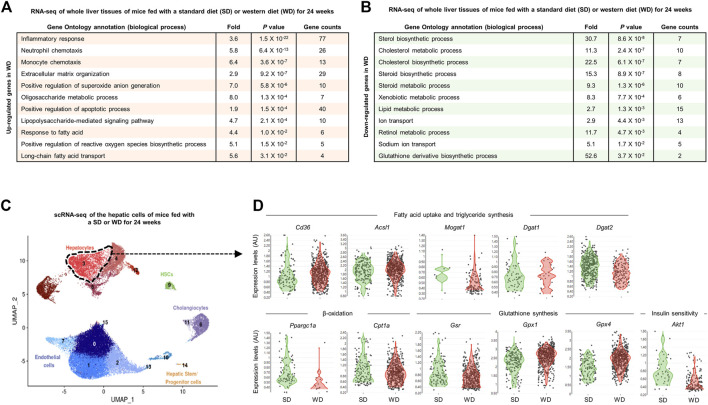
FIGURE 10.
Comprehensive transcriptomic analysis of the liver tissues of mice with WD-induced NAFLD. (A,B) Bulk RNA-seq analysis of whole liver tissues of mice fed with a standard diet (SD) or western diet (WD) for 24 weeks (GSE172297). Gene ontology biological processes were analyzed from the list of upregulated (A) or downregulated (B) genes in WD-fed compared to SD-fed liver tissues. (C,D) Single-cell RNA-seq (scRNA-seq) analysis of the hepatic cells of mice fed with SD or WD for 24 weeks (GSE156059). (C) Feature plot for cell types presented by uniform manifold approximation and projection (UMAP). (D) Violin plots for expression levels of genes related to indicated pathways in hepatocytes (cluster 3). AU, arbitrary unit; UMAP, uniform manifold approximation and projection.

