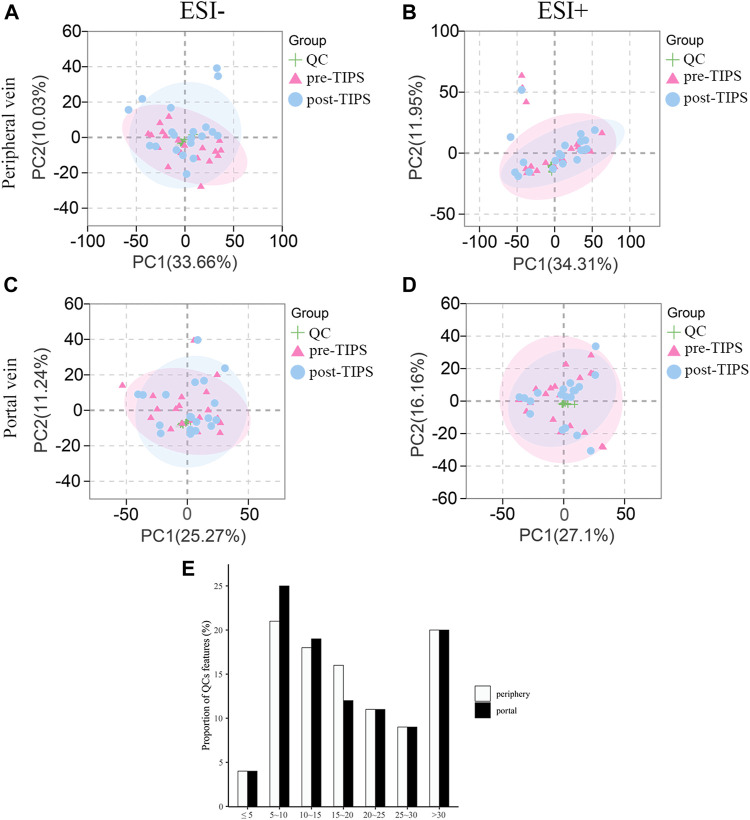
FIGURE 2.
Principal component analysis (PCA) score plots for all samples and coefficients of variation distribution of quality control (QC) samples. QC samples cluster tightly together in both ESI- and ESI + mode of peripheral (A, B) and portal serum (C, D). (E) Coefficients of variation distribution of QC samples in the combinational dataset of ESI+ and ESI- modes from the peripheral and portal serum. ESI-: negative electrospray ionization; ESI+: positive electrospray ionization.

