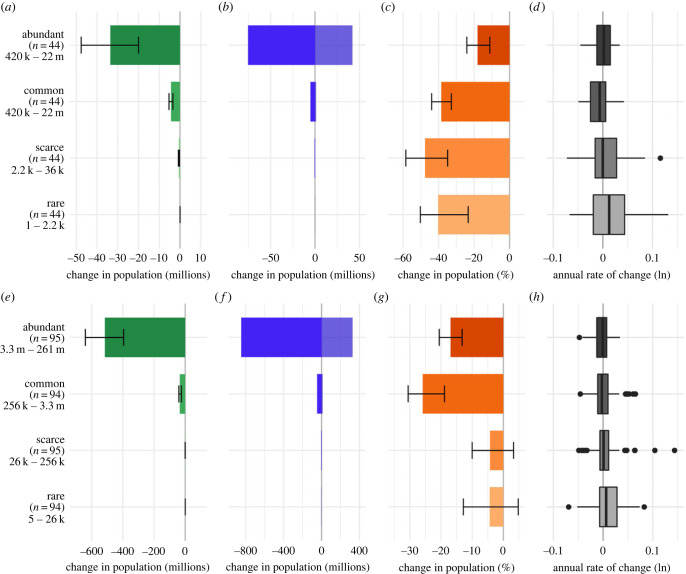
Figure 2.
Patterns of change in native breeding bird species in the UK from 1966 to 2018 (a–d) and EU from 1980 to 2017 (e–h), disaggregated by abundance category. Net change in (a) UK and (e) EU total abundance (millions of individuals) with 95% credible intervals. Total increase in (b) UK and (f) EU species with positive trends and total decrease in species with negative trends (millions of individuals). Per cent change in total abundance (c) UK and (g) EU with 95% credible intervals. Box plot of average annual rates of change across species (d) UK and (h) EU on a log scale. In brackets, the number of species and range of species’ population sizes in each category. (Online version in colour.)

