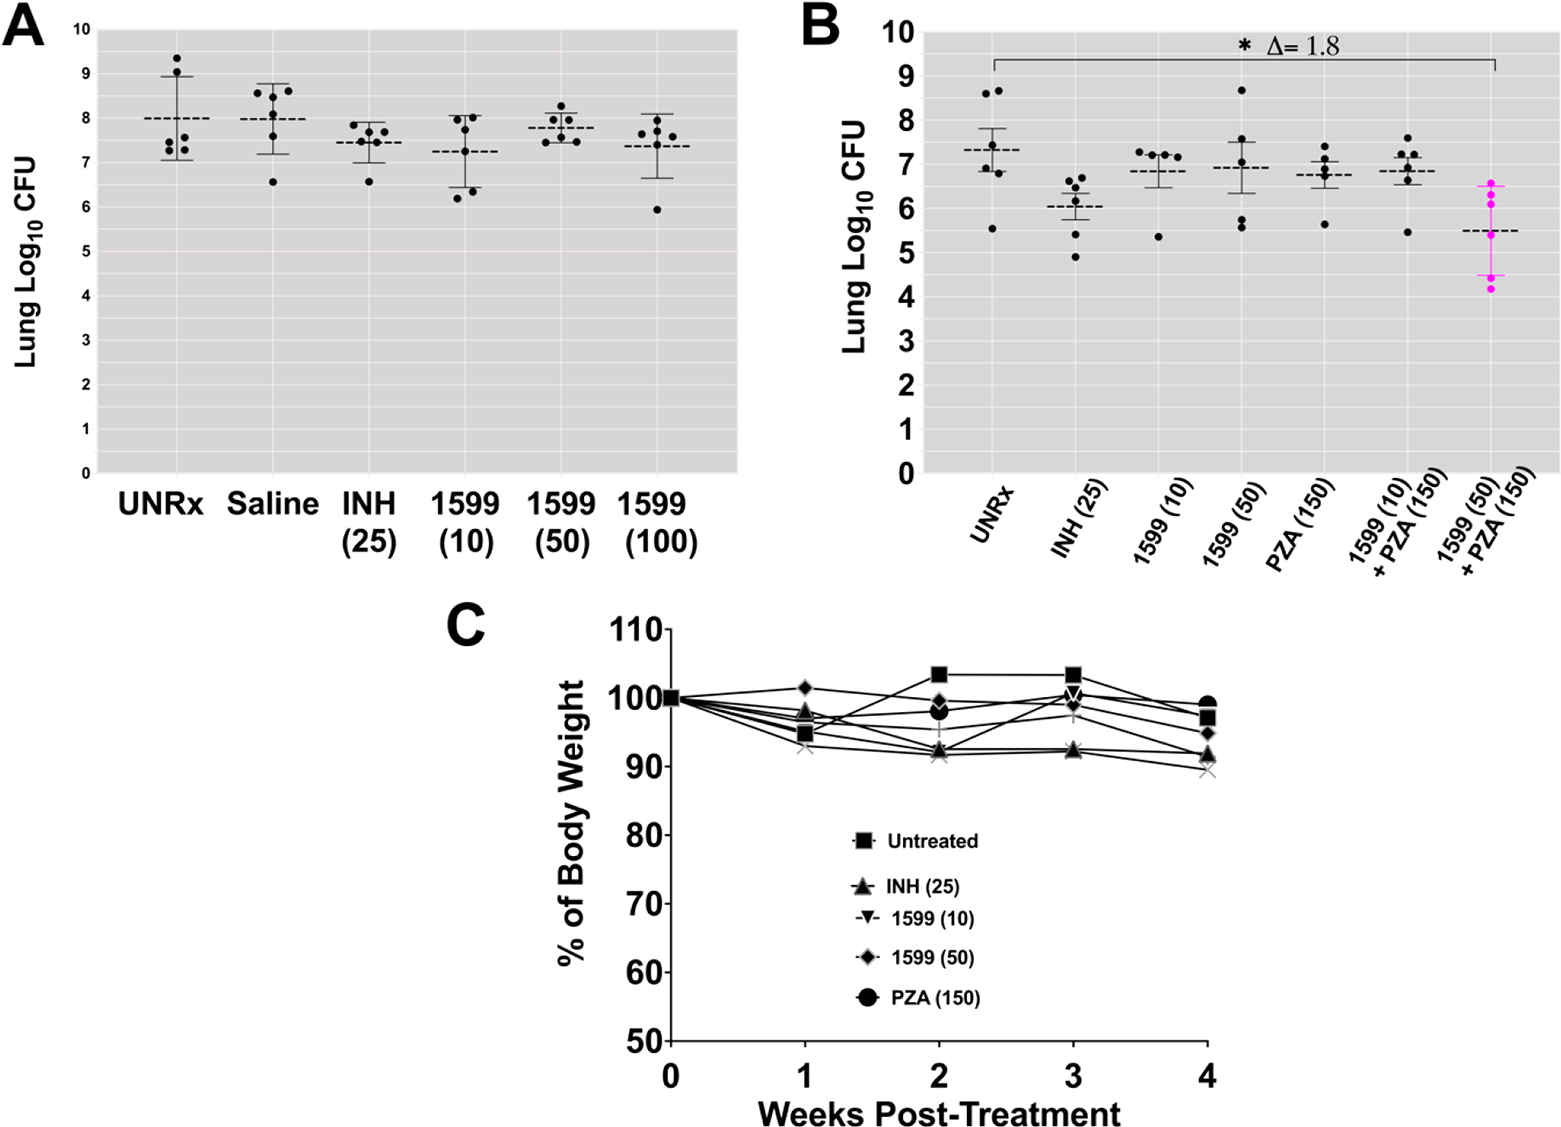
Figure 6.

Dose response after intrapulmonary aerosol delivery of spectinamide-1599 and pyrazinamide to C3HeB/FeJ chronically infected with Mtb. (A) Spectinamide-1599 (1599) and INH were administered to chronically Mtb infected C3HeB/FeJ mice (n = 5–6) via intrapulmonary aerosol. C3HeB/FeJ female mice were infected with a low dose aerosol infection to deliver ~75 CFU Mtb bacilli per mouse. Mice were rested during 8 weeks until they were randomly assigned to study groups and used to test the therapy under study here. Spectinamide-1599 and INH were prepared in 0.9% low endotoxin saline (saline) at 10, 50, and 100 mg/mL [1599 (10); 1599 (50), and 1599 (100)], whereas INH was prepared at 25 mg/kg [INH (25)]. Except for mice in the untreated group (UnRx), each mouse in each group received 50 μL/dose via intrapulmonary aerosol 3 times a week for 4 weeks. Three days after the last treatment, animals from all groups in the study were euthanized, and the whole lungs were prepared for bacterial load determination. The bacterial load was determined using serial dilutions of homogenized organs that were plated on 7H11 agar plates, and the CFU in each sample were determined after 3–4 weeks of incubation at 37 °C. Bacterial load in each organ was expressed as the log10 of CFUs. The graph shows representative data from two separate studies. (B) Spectinamide-1599 (1599) and PZA were administered to chronically Mtb infected C3HeB/FeJ mice (n = 5–6) via intrapulmonary aerosol. As in panel A, spectinamide-1599, INH, and PZA were prepared in 0.9% low endotoxin saline at 10 and 50 mg/kg, respectively [1599 (10); 1599 (50)] INH at 25 mg/kg [INH (25)] and PZA at 150 mg/kg [PZA (150)]. Except for mice in the untreated group (UnRx), each mouse in each group received 50 μL/dose of via intrapulmonary aerosol. Some groups received PZA administered orally via gavage daily for 4 weeks. Three days after the last treatment, animals from all groups in the study were euthanized, and the whole lungs were prepared for bacterial load determination as explained in panel A. The graph shows representative data from two separate studies. (C) During therapy, the weights of each mouse in panel B were recorded weekly as average weight of each mouse per cage (n = 5). The graph shows weekly average of weights of 5 mice in each cage during the 4 weeks of therapy.
