Abstract
The choice of deprivation index can influence conclusions drawn regarding the extent of deprivation within a community and the identification of the most deprived communities in the United States. This study aimed to determine the degree of correlation among deprivation indices commonly used to characterize transplant populations. We used a retrospective cohort consisting of adults listed for liver or kidney transplants between 2008 and 2018 to compare 4 deprivation indices: neighborhood deprivation index, social deprivation index (SDI), area deprivation index, and social vulnerability index. Pairwise correlation between deprivation indices by transplant referral regions was measured using Spearman correlations of population-weighted medians and upper quartiles. In total, 52 individual variables were used among the 4 deprivation indices with 25% overlap. For both organs, the correlation between the population-weighted 75th percentile of the deprivation indices by transplant referral region was highest between SDI and social vulnerability index (liver and kidney, 0.93) and lowest between area deprivation index and SDI (liver, 0.19 and kidney, 0.15). The choice of deprivation index affects the applicability of research findings across studies examining the relationship between social risk and clinical outcomes. Appropriate application of these measures to transplant populations requires careful index selection based on the intended use and included variable relevance.
Keywords: clinical research/practice, kidney transplantation/nephrologyliver, transplantation/hepatology, disparitiesqualitative research, transplant, health equity, social deprivation, disparities, community assessment
1. Introduction
Social determinants of health (SDOH) include a range of factors that reflect conditions in the environments where people are born and live.1–5 It is well established that SDOH mediate both access to and outcomes after organ transplant, but specific causal mechanisms remain elusive.6–9 Community deprivation is an important component of SDOH, particularly in transplant, which requires stable health status over prolonged waiting time and lifelong care after the transplant. Deprivation is influenced by several interrelated factors, including civic infrastructure and resources and neighborhood physical conditions, and community members’ socioeconomic characteristics, which all manifest in influencing public policies and structural inequities. The measurement and incorporation of each individual factor is challenging, and as such, deprivation indices are being used more commonly by health equity researchers across a wide range of medical and surgical specialties, including end-stage organ disease and transplantation.3,4,10–23
Deprivation indices are composite measures developed to provide a summative measure of population demographics and socioeconomic conditions, facilitate comparison across studies and disciplines, and improve understanding of how a patient’s community resources influence health outcomes.24,25 Deprivation indices aggregate relevant SDOH to produce a composite score meant to summarize the social, economic, and ecologic deprivation in a given geographic area.26,27 There are multiple well-known deprivation indices, but no universally accepted metric to capture the social-contextual risk factors across geographic areas in the United States (US).25 As such, the choice of deprivation index is context-dependent, and the applicability of research findings across studies is imprecise. Accurate and precise measurement of SDOH will facilitate standardizing measurement across studies or regions. This can help guide centers and policymakers regarding how SDOH can be addressed in clinical care, research, and aid efforts to ensure that interventions are applied appropriately.
The purpose of this study was to assess the degree of correlation among 4 commonly used deprivation indices: area deprivation index (ADI), social deprivation index (SDI), neighborhood deprivation index (NDI), and social vulnerability index (SVI). We calculated the degree of deprivation among the general population living within liver or kidney transplant referral regions (TRRs) over a 10-year period. We hypothe-sized that the choice of deprivation index would influence both the extent of deprivation within a TRR and the identification of the most deprived subpopulation within a TRR.
2. Materials and methods
2.1. Data sources
Waitlist, patient, and transplant facility datasets, as well as cross-references to link facility identifiers to 4-letter Organ Transplantation Center codes, were obtained from the US Renal Database System (USRDS, www.usrds.org) for kidney and the Scientific Registry of Transplant Recipients www.srtr.org) for the liver. In addition, location data and global positioning system (GPS) coordinates of currently active transplant centers were obtained from the Health Resources Services Administration database of these centers.28 Other spatial data included shape files of hospital referral regions (HRRs),29 a cross-reference to link zone improvement plan (ZIP) codes to HRRs,30 and Topologically Integrated Geographic Encoding and Referencing system (TIGER)/line shape files for census tracts and block groups from the 2010 decennial census.31,32 The total population counts in each census tract were obtained from the American Community Survey (ACS) dataset for the 5-year period ending in 2018.33 A census tract is defined as a statistical subdivision of a county containing between 1200 and 8000 people.
2.2. Deprivation indices
The deprivation indices included in the study were ADI (data beginning from 2018),34 SDI (data beginning from 2015),35 NDI (data beginning from 2017),36 and SVI (data beginning from 2018).37 All indices use the US Census estimates from the 5-year period ending in the respective years. NDI ranges from −2.5 to +1.9, with higher values indicating more neighborhood deprivation, whereas ADI, SDI, and SVI consist of national percentiles that range from 1 to 100, with higher numbers indicating a higher level of disadvantage.
2.3. TRR derivation
TRRs for kidney and liver transplants were derived using the methodology described by Ross-Driscoll et al.38 In total, 59 TRRs were derived for 70 unique single or combined liver transplant centers, and 102 TRRs were derived for 114 single or combined kidney transplant centers using the following process:
Using GPS coordinates of each transplant center, all pairwise great-circle distances were calculated, and centers that were located within 10 miles of each other were combined.
Each waitlist entry was uniquely linked to an HRR via the waitlisted patient’s home ZIP code using the ZIP-to-HRR cross-reference.
HRRs were assigned to the center with the greatest number of waitlist entries during the study period.
HRRs assigned to the same transplant center were spatially combined (dissolved) to define a TRR catchment area for that center.39 TRRs that consisted of discontinuous regions were retained.
2.4. Study period and cohort definitions
The study period was from January 1, 2008 to December 31, 2018. Adult waitlist entries for kidney transplantation that met the following criteria were included: (1) occurred at a USRDS facility that performed at least 1 transplant during the study period, (2) USRDS patient identifier, transplant center identifier, interval start date, and patient date of birth were not missing, (3) at least 1 day of the interval on the waitlist period occurred during the study period, and (4) the waitlist interval start date was not missing and did not occur after the recorded interval end date.
Adult waitlist entries for liver transplantation that met the following criteria were included: (1) unique person identifier, date of activation on the kidney transplant waitlist, transplant center identifier, and patient age at listing were not missing, (2) waitlist interval contained at least 1 day during which patient was listed as active in the study period, (3) date of activation on the kidney transplant waitlist did not occur after removal date, (4) removal code was not missing, and (5) listing date was not missing and not the same date as removal date.
For the liver cohort, overlapping waitlist intervals at the same facility were collapsed into a single interval, and portions of waitlist intervals that occurred after a known transplant were dropped to closely approximate the approach to the USRDS data for the kidney transplant cohort.40 The waitlist intervals that contained missing end dates were assumed to represent patients who were active on the waitlist as of the creation of the dataset. All intervals were administratively right-censored on the last day of the study period and left-censored using each patient’s date of 18th birthday.
2.5. Linking deprivation indices to TRRs
In order to link census tracts and associated deprivation indices to TRRs, we used a direct spatial intersection method in which all pairwise spatial intersections between each TRR and census tract were found, and the area of the intersection was computed; each census tract was then assigned to the TRR with which the area of the intersection was greatest.39,41,42 Portions or entire census tracts that were not included in HRR boundaries were excluded during this step.
All deprivation indices are published at the census tract spatial scale except for ADI, for which the native spatial scale is the smaller census block group. In order to compare indices at a common spatial scale, ADI was aggregated from census block groups to census tracts by calculating population-weighted median ADI values for each census tract from constituent census block groups using the total population count data from the corresponding 5-year ACS dataset as weights.
2.6. Aggregating deprivation index data
Aggregation from census tract to TRR was performed separately for each deprivation index by calculating both population-weighted median and 75th percentiles from the raw values of each index for each TRR; total population count data from the 5-year ACS dataset ending in 2018 were used as weights. For ADI specifically, the TRR-level weighted medians and 75th percentiles were calculated using the derived census tract-level weighted medians described above.
2.7. Correlation analysis
Pairwise correlation between deprivation indices for population-weighted medians and 75th percentiles were examined at 2 spatial scales, TRR and census tract, using Spearman nonparametric rank correlation. Pairwise complete observations were used such that for a given pair of indices, observations for which either of the 2 indices had a missing value were dropped.
2.8. Correlation of indices within the institutional TRR
To examine the correlation among indices at a small spatial scale for a geographic area of interest, the top 10th percentile of deprived census tracts within our institutional kidney and liver TRRs were calculated for each deprivation index. For each census tract, the number of indices assigning it among the top 10th percentile of deprived were counted. The counts for census tracts within our regional area were visually examined using a choropleth map, and correlation was tabulated by census tract.
2.9. Sensitivity analyses
A sensitivity analysis was performed to examine if spatial scale influenced the degree of correlation by reaggregating ADI from the census block group to the census tract using 3 additional metrics and then reexamining the correlation with the other indices based on population-weighted mean, unweighted median, and unweighted mean. An additional sensitivity analysis was performed to examine the effect of using population estimates sourced from corresponding time periods for each deprivation index as opposed to common population weights from the 5-year period ending in 2018.
All data management and statistical and spatial analyses were performed using the R project for statistical computing and relevant packages via the R Studio software (RStudio, Inc).43
3. Results
3.1. Variables included in deprivation indices
In total, 52 individual variables were used among the 4 deprivation indices, 13 in the NDI, 7 in the SDI, 17 in the ADI, and 15 in the SVI (Table 1). In all, 13 (25%) of variables were used in >1 index: 2 variables (unemployment and poverty) were used in all 4 indices, 6 variables (lower education, lack of vehicle, income, single-parent household, crowding, and owner-occupied housing) were used in 3 indices, and 5 variables (lack of telephone, home value, lack of plumbing, employment, and higher education) were used in 2 indices.
Table 1.
Summary of deprivation indices.
| Neighborhood deprivation index (NDI) | Social deprivation index (SDI) | Area deprivation index (ADI) | Social vulnerability index (SVI) | |
|---|---|---|---|---|
| Data source | American Community Survey | US Census Data | American Community Survey 5-Y Estimates | US Census Data |
| Variables | 1. % employed in management | 1. <12 Y of schooling | 1. % of block group’s population aged >=25 years with <9 years of education | 1. Below poverty |
| 2. % unemployment | 2. Crowding | 2. % aged >=25 years with >= a high school diploma | 2. Unemployed | |
| 3. % high school graduates | 3. No car | 3. % of employed persons >=16 y of age in white-collar occupations | 3. Income | |
| 4. % Bachelor’s degree or higher | 4. Unemployed | 4. Median family income | 4. No high school diploma | |
| 5. % Households without telephone | 5. Poverty | 5. Income disparity | 5. Aged ≥65 y | |
| 6. % Households without plumbing | 6. Renter occupied | 6. Median home value | 6. Aged ≤17 y | |
| 7. Household income | 7. Single-parent family | 7. Median gross rent | 7. Civilian with a disability | |
| 8. Home value | 8. Median monthly mortgage | 8. Single-parent households | ||
| 9. % Family poverty | 9. % Owner-occupied housing units (homeownership rate) | 9. Minority | ||
| 10. % Public assistance | 10. % Civilian labor force population >=16 y of age unemployed (unemployment rate) | 10. Aged ≥5 y who speak English “less than well” | ||
| 11. % Female-headed household | 11. % Families below the poverty level | 11. Multiunit structures | ||
| 12. % Owner-occupied housing units | 12. % Population below 150% of the poverty threshold | 12. Mobile homes | ||
| 13. % Housing units receiving interest/dividends/rental income | 13. % Single-parent households with children <18 y of age | 13. Crowding | ||
| 14. % Occupied housing units without a motor vehicle | 14. No vehicle | |||
| 15. % Occupied housing units without a telephone | 15. Group quarters | |||
| 16. % Occupied housing units without complete plumbing (log) | ||||
| 17. % Occupied housing units with >=1 person per room (crowding) | ||||
| Intended use | To identify the geospatial variations of SES across different areas | To quantify levels of disadvantage across small areas, evaluate their associations with health outcomes, and address health inequities | To improve access and facilitate broad application, a neighborhood-disadvantage metric should be inclusive of all US neighborhoods, regularly updated, rigorously tested for validity, easily accessible, and constructed to meet the needs of a range of possible users | To help emergency response planners and public health officials identify and map communities that will most likely need support before, during, and after a hazardous event. |
| Data usage links | https://www.gis.cancer.gov/research/NeighDeprvIndex_Codebook.pdf | https://www.graham-center.org/rgc/maps-data-tools/sdi/social-deprivation-index.html | https://www.neighborhoodatlas.medicine.wisc.edu/ | https://www.atsdr.cdc.gov/placeandhealth/svi/index.html |
| Y (available) | 2013–2017 | 2008–2012, 2011–2015 | 2014–2018 | 1999–2000, 2006–2010, 2010–2014, 2012–2016, 2014–2018 |
| Areas | Census tract | Census tract | Census block | Census tract |
| Reference range | −2.5 to +1.9 (higher values indicate more neighborhood deprivation = lower SES) | 1 (lowest level of disadvantage) to 100 (highest level of disadvantage) | 1 (lowest level of disadvantage) to 100 (highest level of disadvantage) | 1 (lowest level of disadvantage) to 100 (highest level of disadvantage) |
| Limitations | Geographic scale as NDI may be better illustrated on the census tract or census block level to draw more specific conclusions regarding a specific population’s neighborhood-level exposure | Outcome measures are estimates based on county measures | Estimates based on geographic units, subject to accuracy and errors contained in the American Community Survey, limited accounting for undocumented-immigrant populations | Estimates based on census data |
SES, socioeconomic status; US, United States.
3.2. Correlation of deprivation indices
SDI and SVI showed the highest pairwise correlation (0.88), whereas ADI and SDI exhibited the lowest pairwise correlation (0.51) at the census tract scale (Fig. 1). ADI showed the lowest correlation among all 4 indices considered. Spearman correlation between the population-weighted 75th percentile of the deprivation indices at the TRR scale was highest between SDI and SVI (liver and kidney, 0.93) and lowest between ADI and SDI (liver, 0.19 and kidney: 0.15) (Fig. 2). Sensitivity analyses performed with the ADI reaggregated from the census block group to the census tract using 3 additional metrics did not change our results, nor did using population estimates sourced from corresponding time periods for each deprivation index as opposed to common population weights from the 5-year period ending in 2018.
Figure 1.
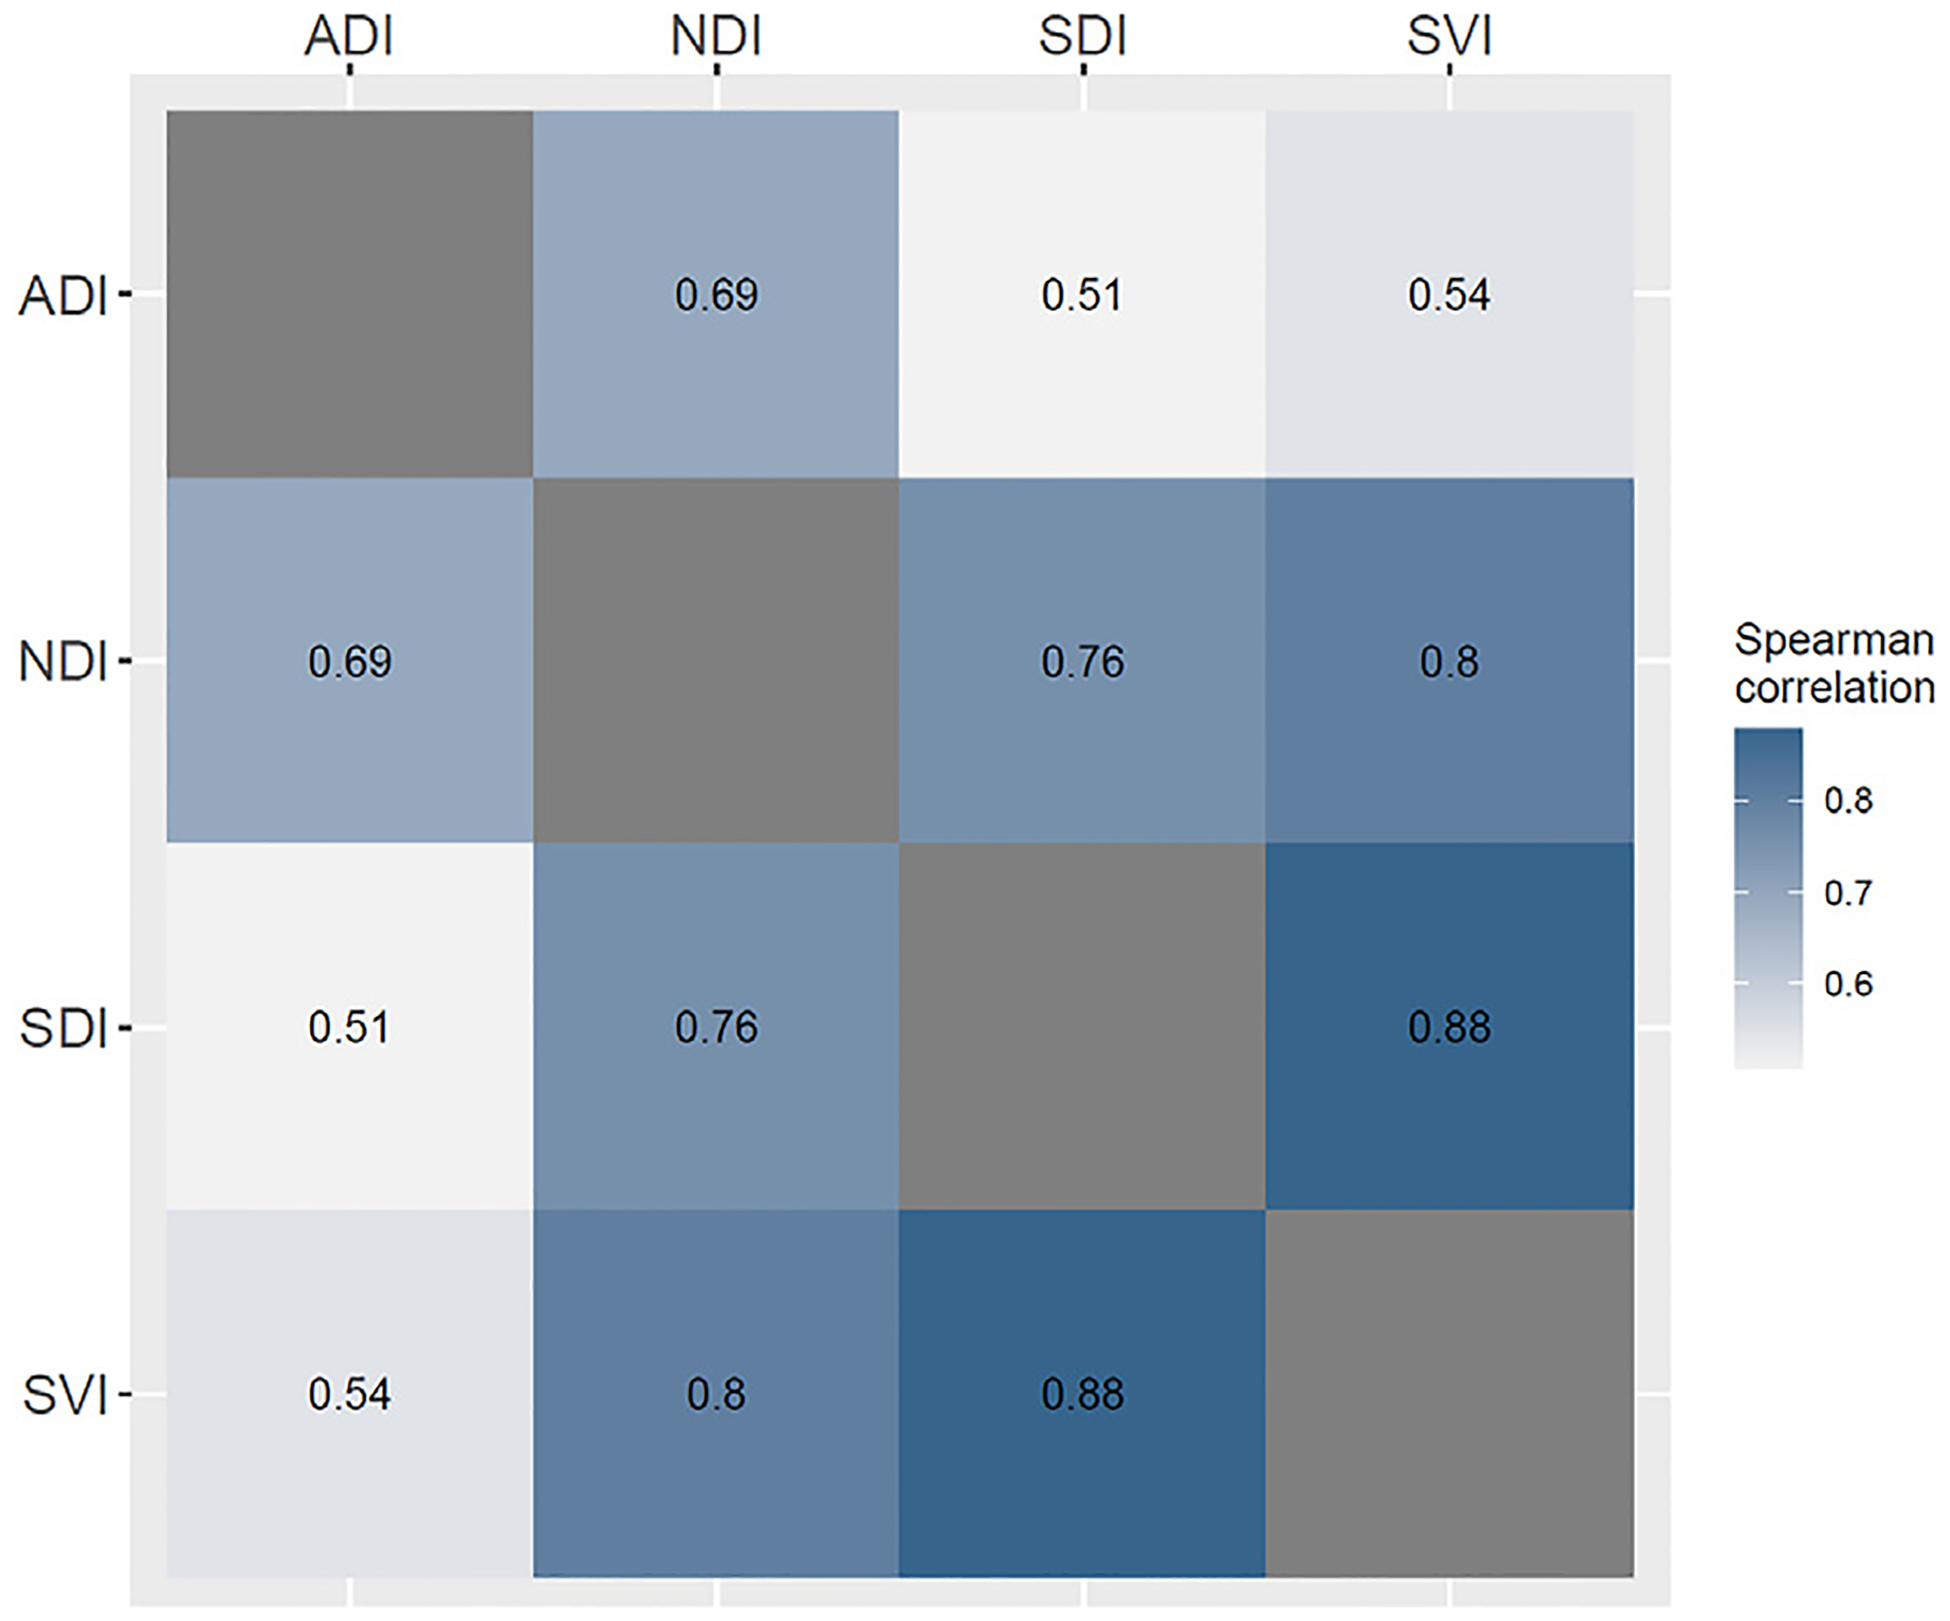
Pairwise Spearman correlation between deprivation indices at census tract spatial scale. Note that values for ADI have been aggregated using population-weighted median from census block groups. ADI, area deprivation index; NDI, neighborhood deprivation index; SDI, social deprivation index; SVI, social vulnerability index.
Figure 2.
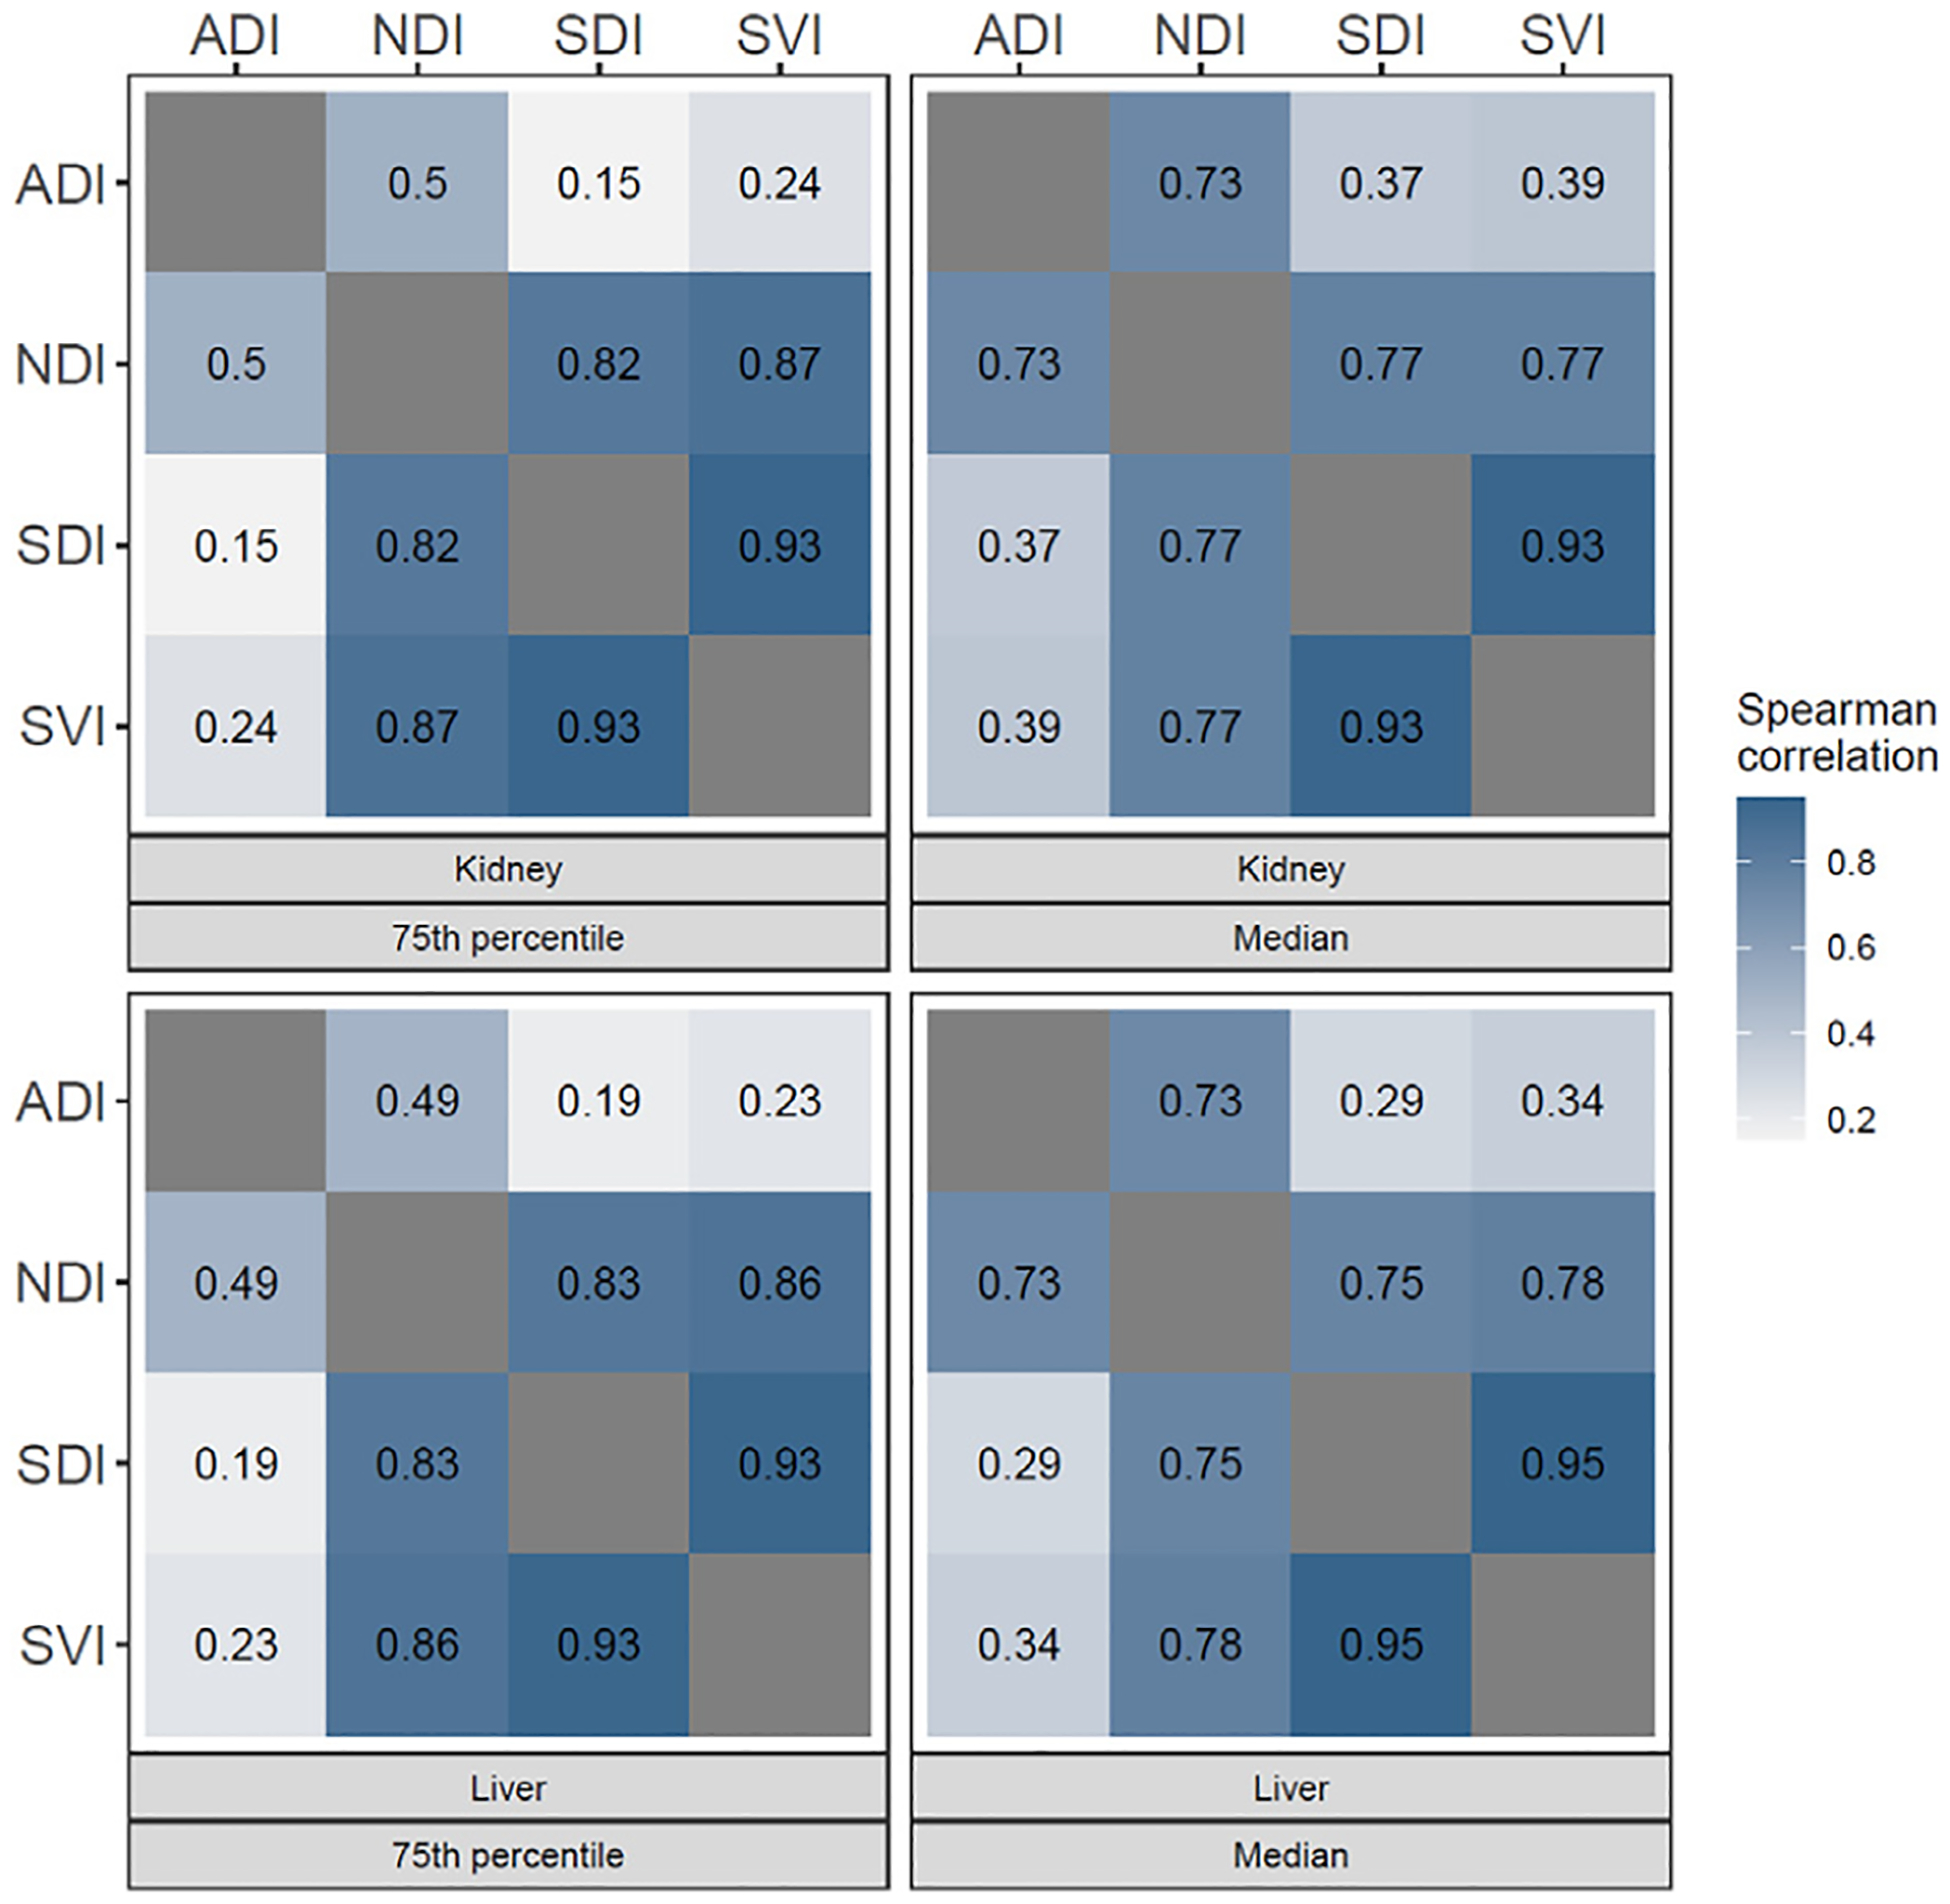
Pairwise Spearman correlation between population-weighted 75th percentiles and medians in kidney and liver TRRs. ADI, area deprivation index; NDI, neighborhood deprivation index; SDI, social deprivation index; SVI, social vulnerability index; TRR, transplant referral region.
4. Correlation of indices in the institutional TRR
There was generally a low correlation among the indices in identifying the top 10th percentile of deprived census tracts within our institutional TRR for both kidneys (Fig. 7) and liver (Fig. 8). There was only a single census tract within the regional area for which all 4 deprivation indices agreed was among the top 10th percentile of deprived census tracts in the institutional TRR, representing only 3.8% and 5.9% of the 26 and 17 census tracts identified as among the top 10th percentile for at least 1 of the indices in kidney and liver TRRs, respectively (Supplementary Table). Conversely, 50% and 41.2% of the 26 and 17 census tracts considered as among the top 10th percentile for at least 1 of the indices in kidney and liver TRRs, respectively, were identified as such by a single deprivation index.
Figure 7.
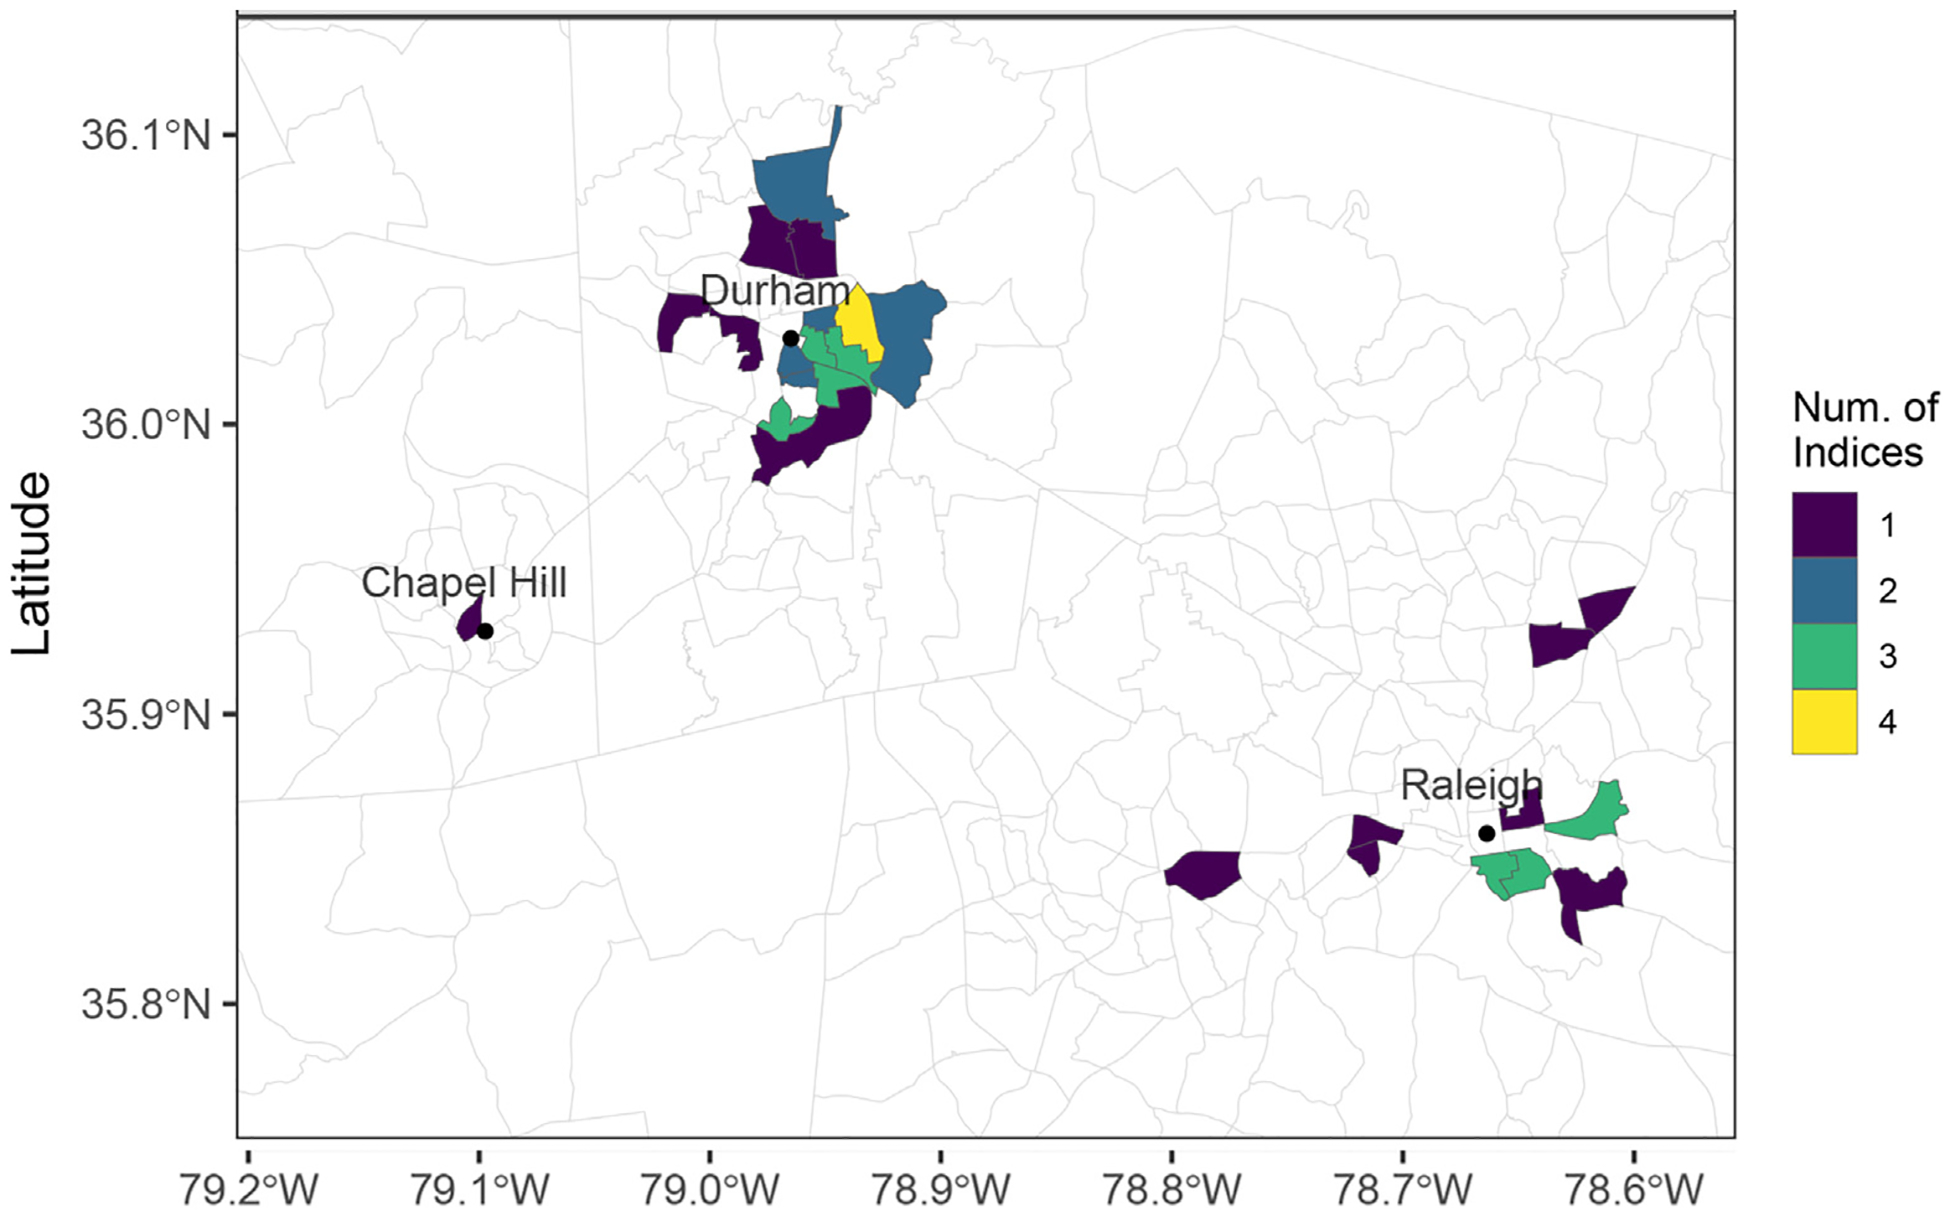
Choropleth map of the regional area with color indicating the number of indices that identify each census tract as ranked among the top 10th percentile of deprived census tracts within the kidney TRRs where our institution is located. TRR, transplant referral region.
Figure 8.
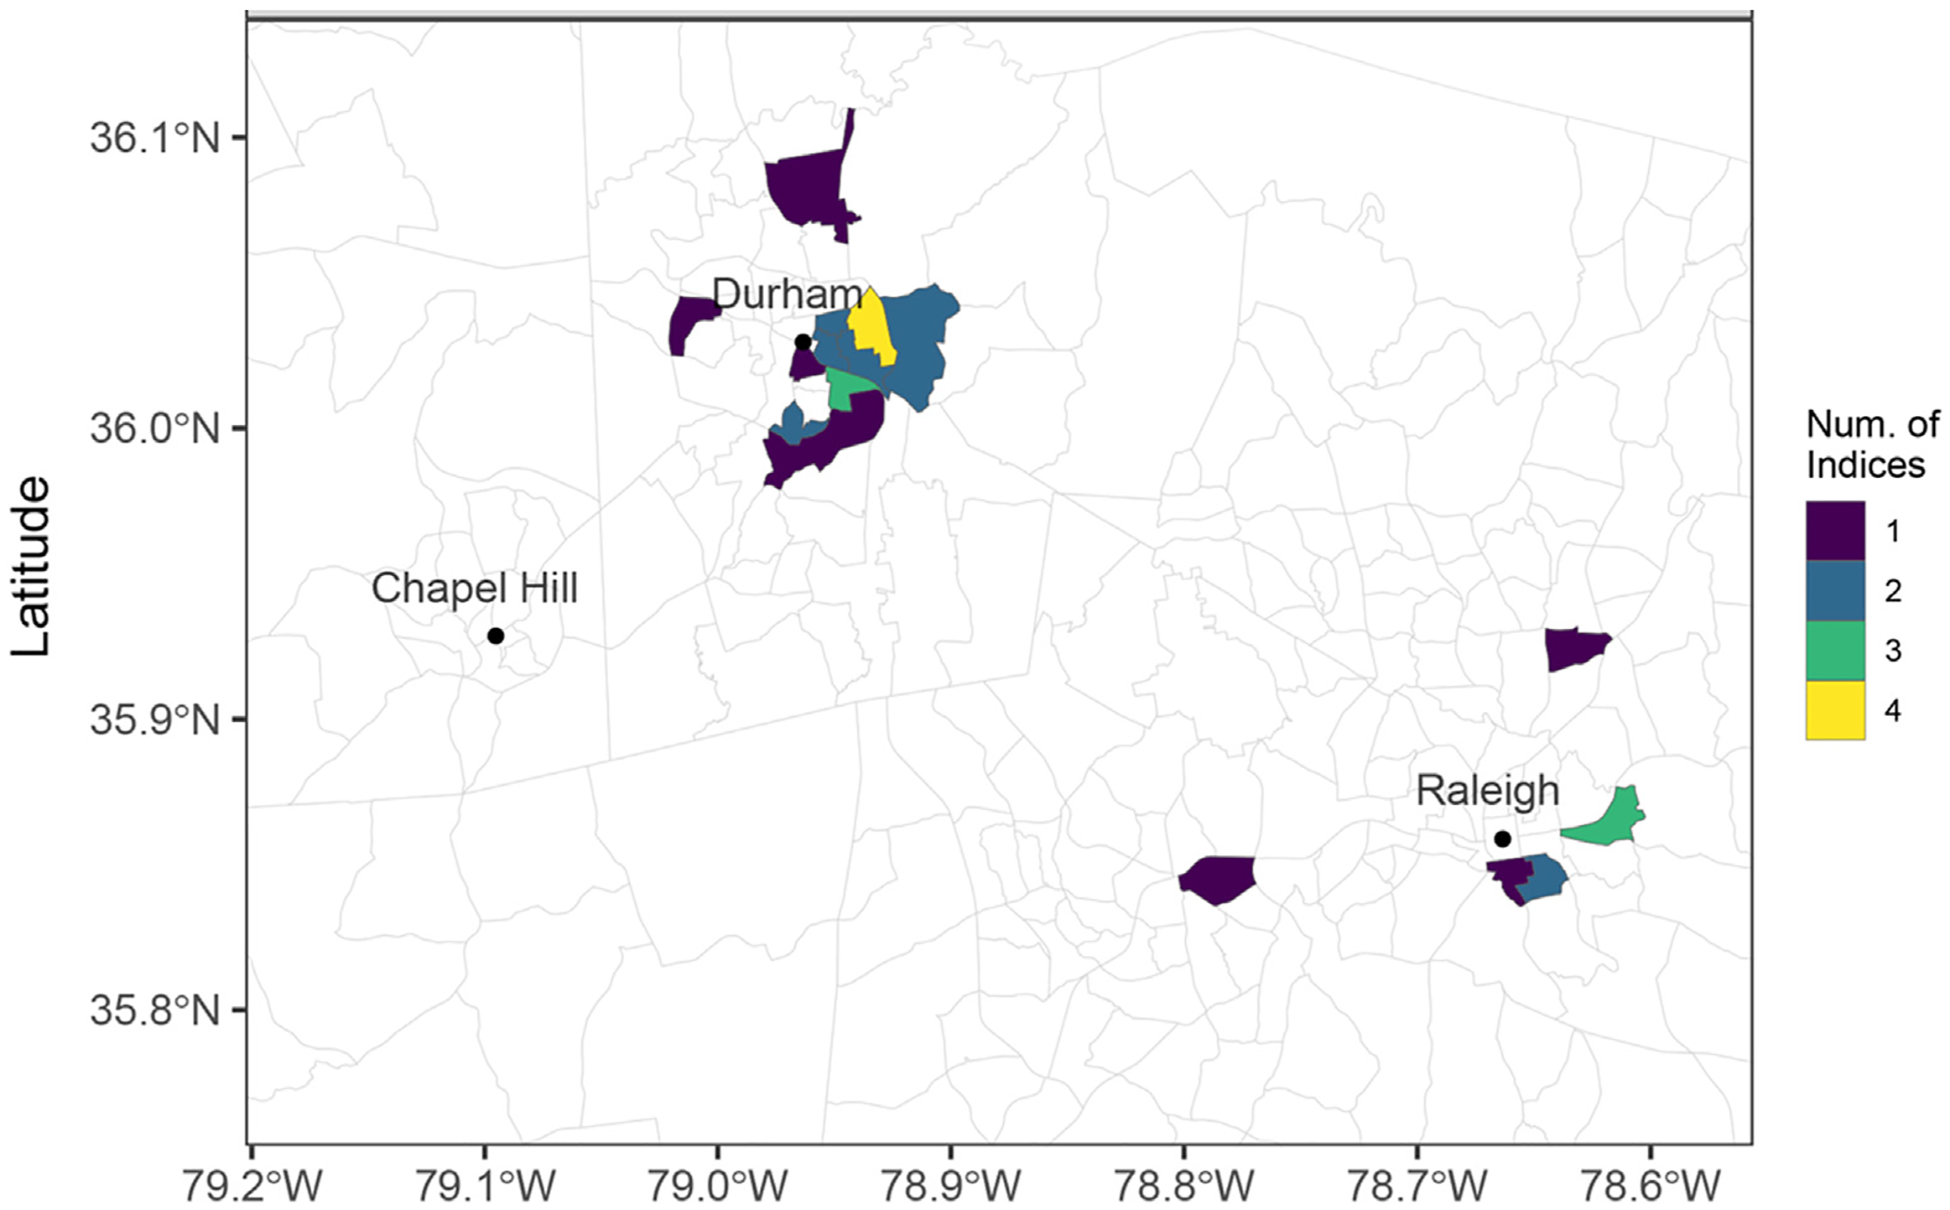
Choropleth map of the regional area with color indicating the number of indices that identify each census tract as ranked among the top 10th percentile of deprived census tracts within the liver TRRs where our institution is located. TRR, transplant referral region.
4.1. Extent of deprivation among TRRs
Among the liver TRRs, median and interquartile ranges (IQR) of population-weighted median deprivation levels for the 4 indices were: NDI, 0.04 (0.3); SDI, 49.0 (16.5); ADI, 51.1 (23.2); and SVI, 46.1 (18.9) (Fig. 3a–d). Medians (IQR) of population-weighted 75th percentiles of deprivation levels for the 4 indices were: NDI, 0.5 (0.3); SDI, 72.0 (11.0); ADI, 68.2 (26.4); and SVI, 68.3 (15.1) (Fig. 4a–d).
Figure 3.
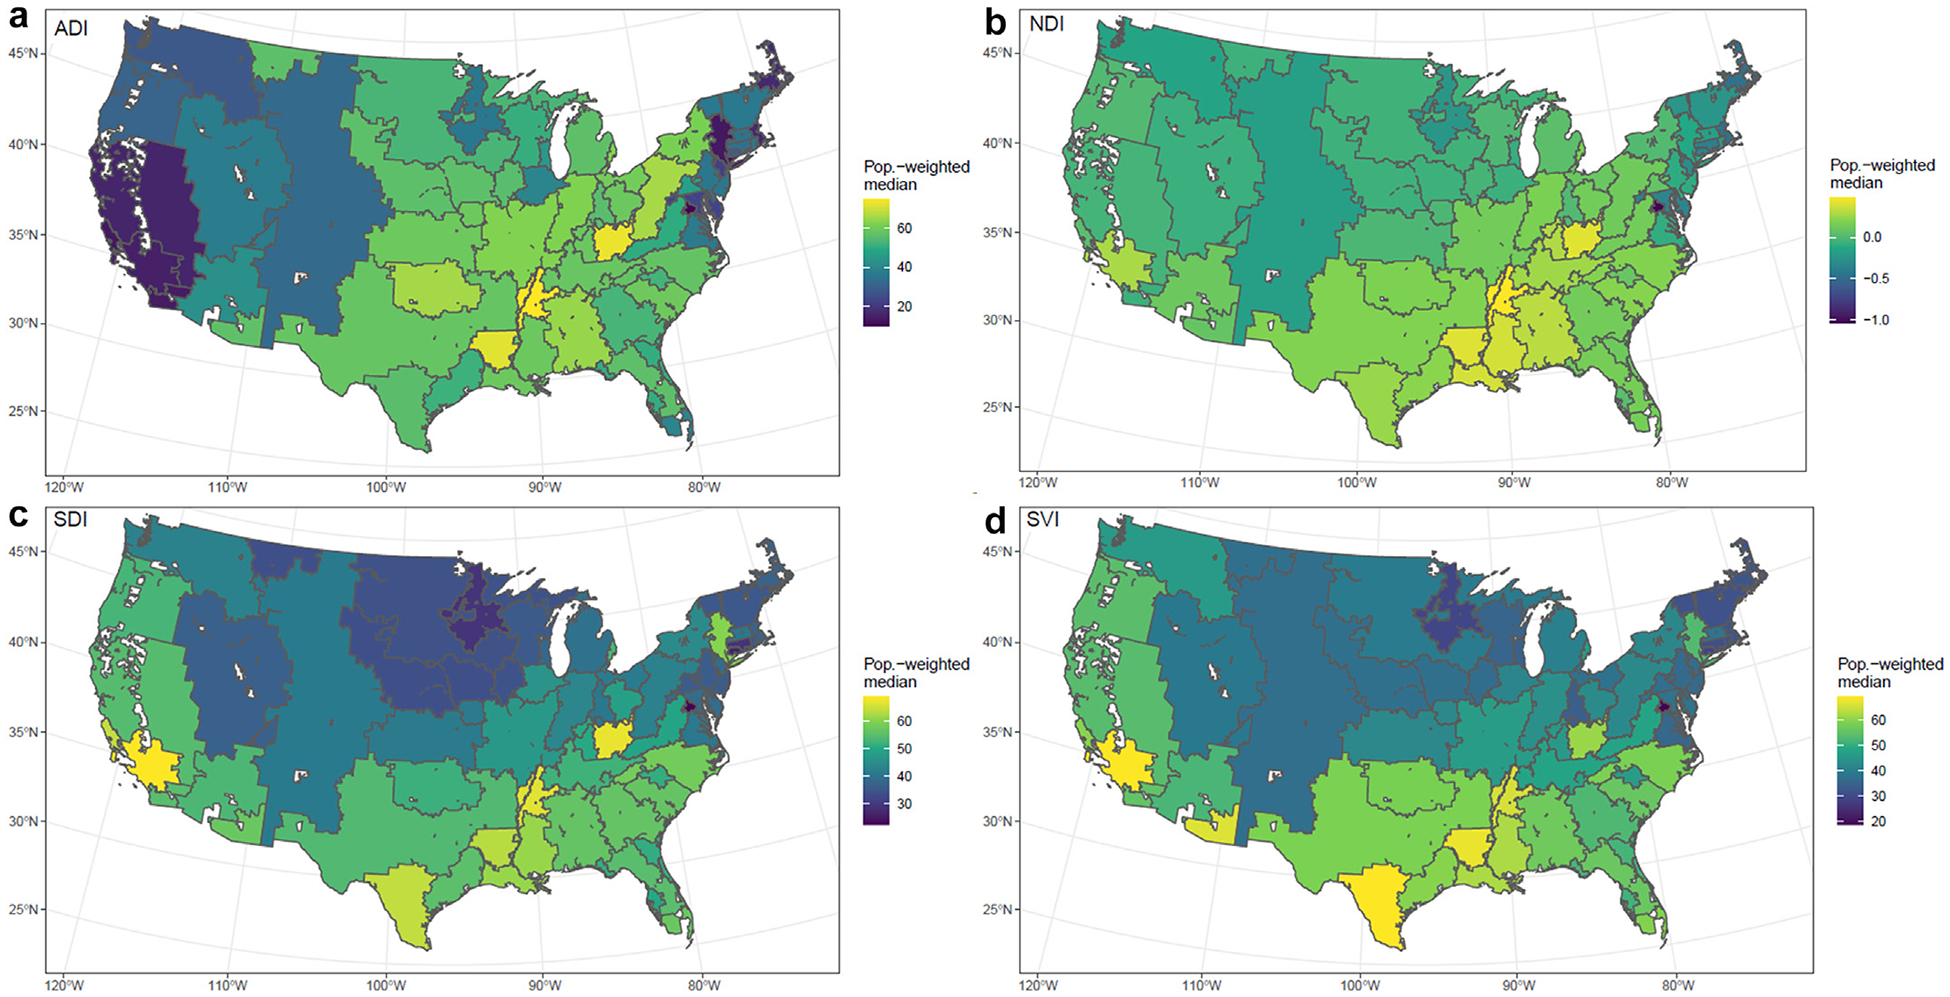
(a) Population-weighted ADI median of deprivation index aggregated from census tract among liver TRRs. (b) Population-weighted NDI median of deprivation index aggregated from census tract among liver TRRs. (c) Population-weighted SDI median of deprivation index aggregated from census tract among liver TRRs. (d) Population-weighted SVI median of deprivation index aggregated from census tract among liver TRRs. ADI, area deprivation index; NDI, deprivation index; SDI, social deprivation index; SVI, social vulnerability index; TRR, transplant referral region.
Figure 4.
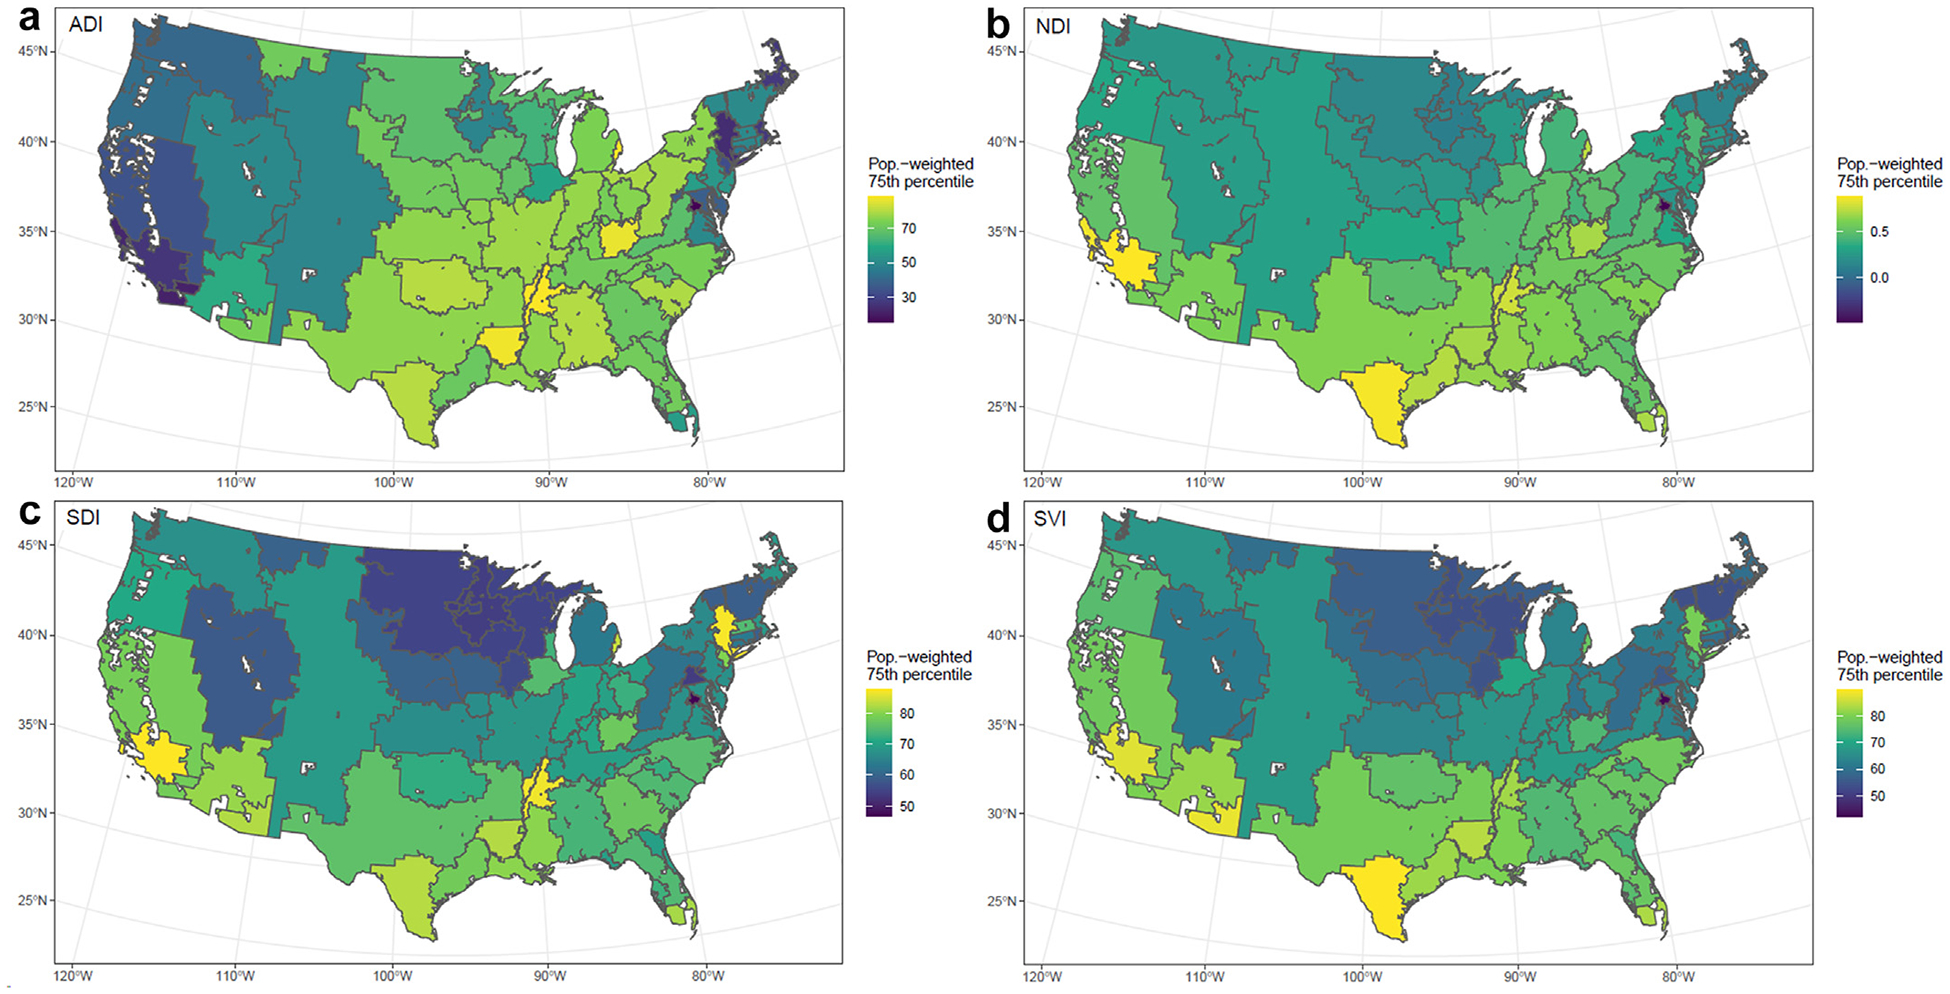
(a) Population-weighted 75th percentile ADI of deprivation index aggregated from census tract among liver TRRs. (b) Population-weighted 75th percentile NDI of deprivation index aggregated from census tract among liver TRRs. (c) Population-weighted 75th percentile SDI of deprivation index aggregated from census tract among liver TRRs. (d) Population-weighted 75th percentile SVI of deprivation index aggregated from census tract among liver TRRs. ADI, area deprivation index; NDI, deprivation index; SDI, social deprivation index; SVI, social vulnerability index; TRR, transplant referral region.
Among kidney TRRs, medians (IQR) of population-weighted median deprivation levels for the 4 indices were: NDI, 0.04 (0.3); SDI, 45.2 (16.0); ADI, 51.4 (22.8); and SVI, 44.4 (17.6) (Fig. 5a–d). Medians (IQR) of population-weighted 75th percentiles of deprivation level for the 4 indices were: NDI, 0.4 (0.3); SDI, 70.2 (13.4); ADI, 67.8 (24.5); and SVI, 67.2 (16.8) (Fig. 6a–d).
Figure 5.
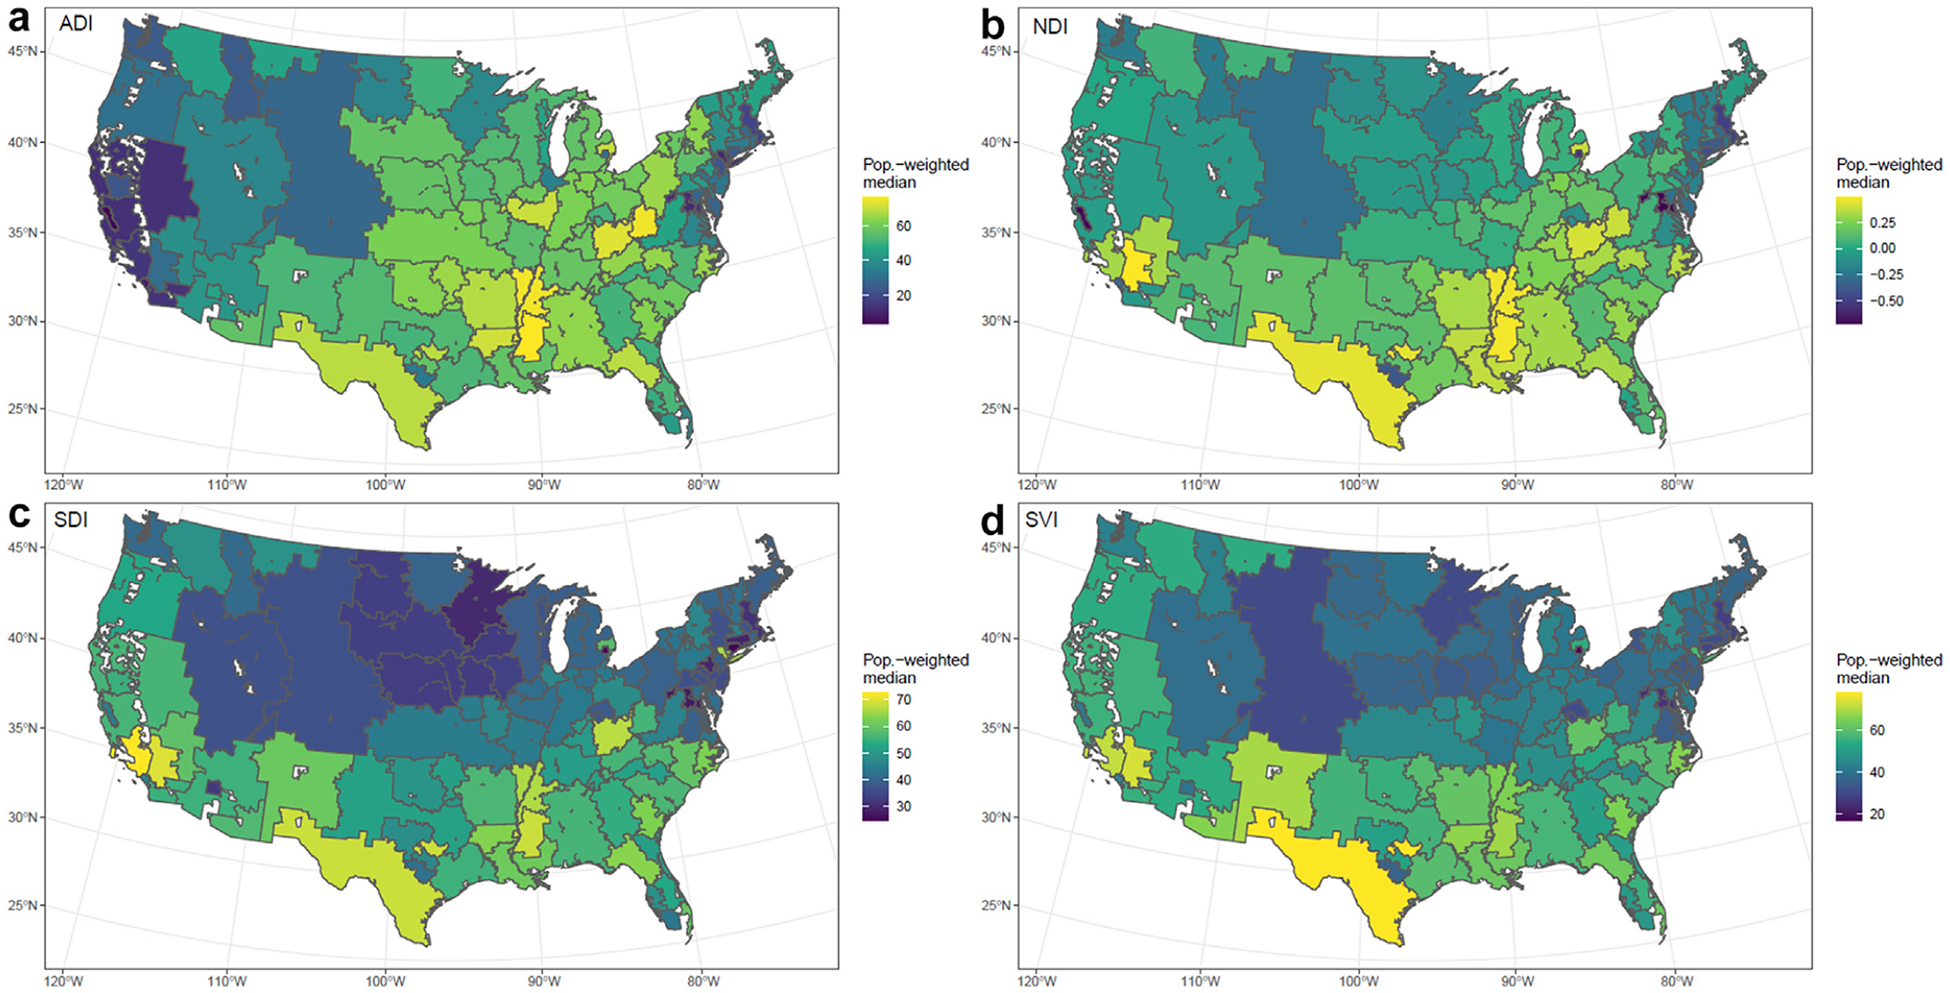
(a) Population-weighted ADI median of deprivation index aggregated from census tract among kidney TRRs. (b) Population-weighted NDI median of deprivation index aggregated from census tract among kidney TRRs. (c) Population-weighted SDI median of deprivation index aggregated from census tract among kidney TRRs. (d) Population-weighted SVI median of deprivation index aggregated from census tract among kidney TRRs. ADI, area deprivation index; NDI, deprivation index; SDI, social deprivation index; SVI, social vulnerability index; TRR, transplant referral region.
Figure 6.
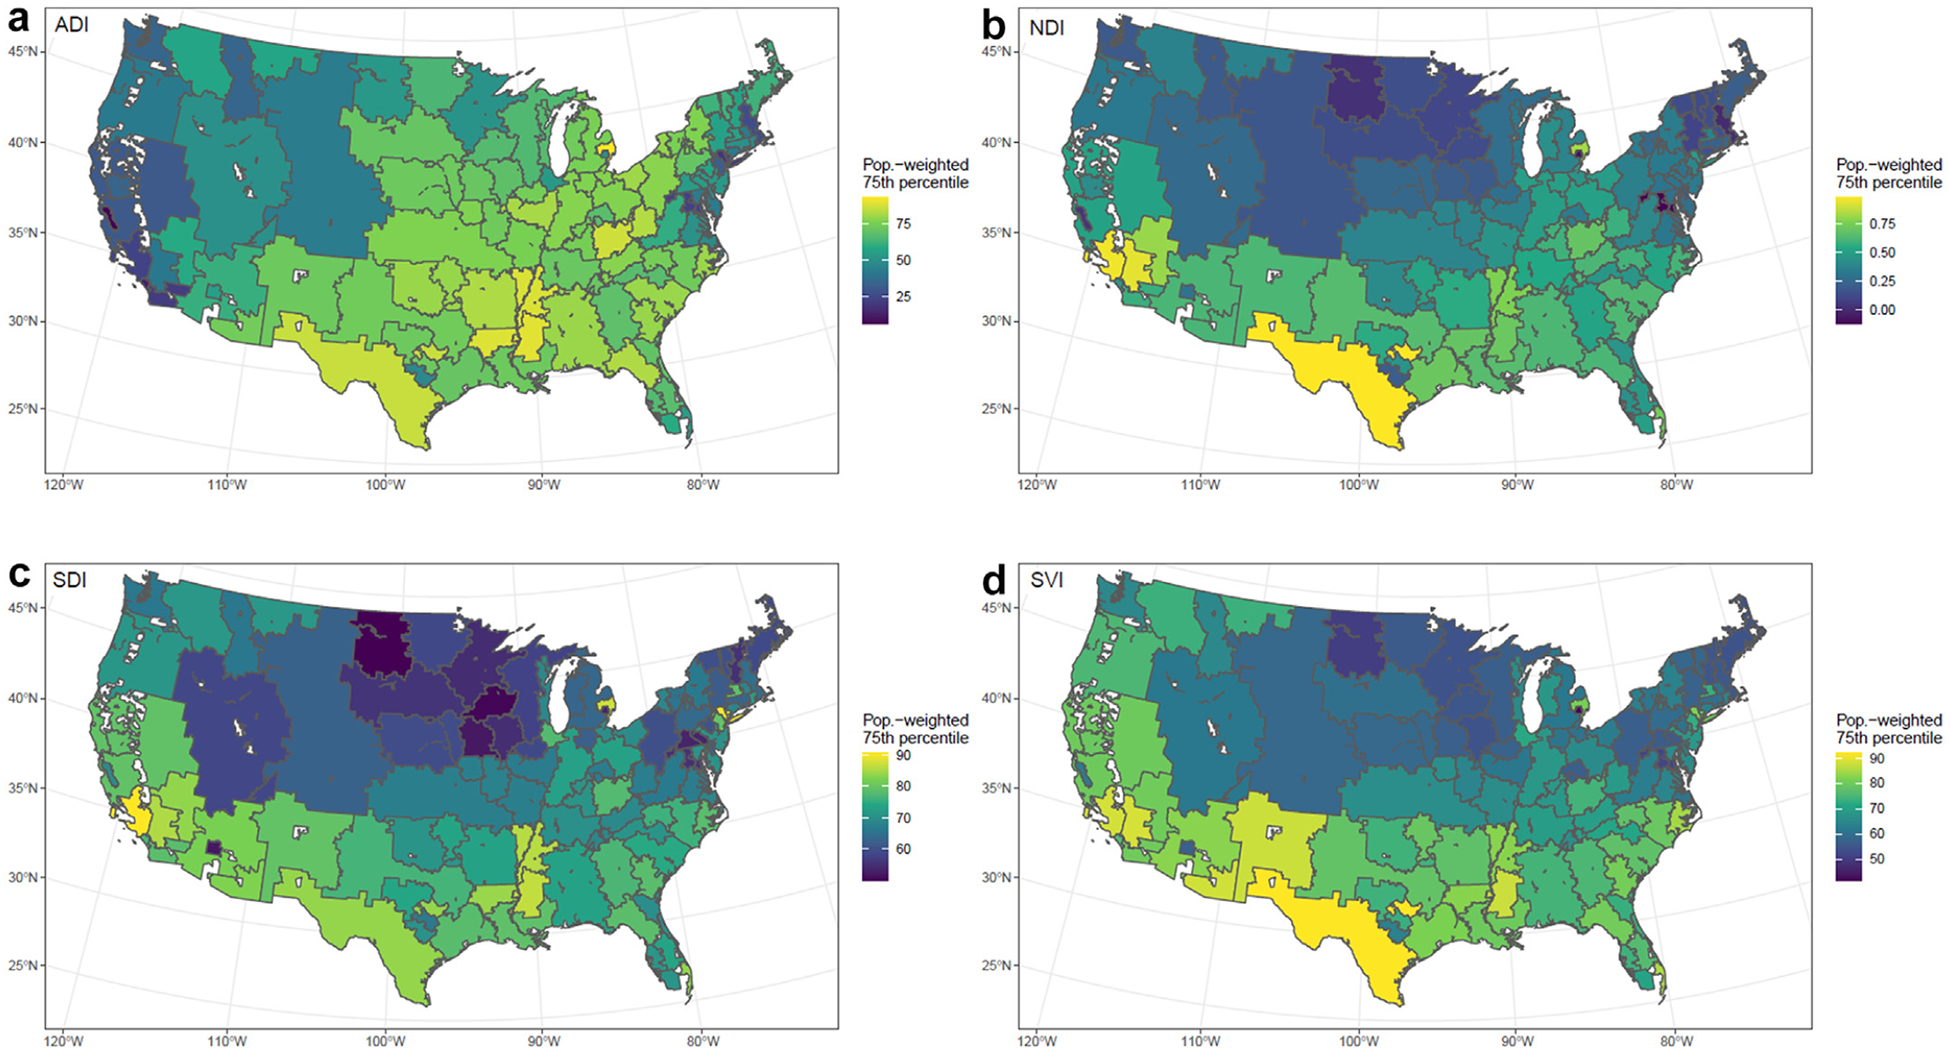
(a) Population-weighted 75th percentile ADI of deprivation index aggregated from census tract among kidney TRRs. (b) Population-weighted 75th percentile NDI of deprivation index aggregated from census tract among kidney TRRs. (c) Population-weighted 75th percentile SDI of deprivation index aggregated from census tract among kidney TRRs. (d) Population-weighted 75th percentile SVI of deprivation index aggregated from census tract among kidney TRRs. ADI, area deprivation index; NDI, deprivation index; SDI, social deprivation index; SVI, social vulnerability index; TRR, transplant referral region; TRR, transplant referral region.
5. Discussion
Deprivation indices have recently gained attention in organ transplant and are being used with increasing frequency to investigate inequities in transplant access and outcomes.16,44–47 Understanding the extent of social deprivation within a TRR may also inform the center’s prioritization of resources for policy initiatives, community outreach, social support, and clinical care. In this study, we sought to assess the degree of correlation among 4 commonly used deprivation indices: ADI, SDI, NDI, and SVI. We found wide variability in the degree of correlation between indices, with Spearman correlation coefficients ranging from 0.19 to 0.95 in the liver TRRs and 0.15 to 0.93 in the kidney TRRs. We also found substantial variability among the 4 studied indices in identifying the most (75th percentile) deprived areas in the US, as well as identification of the 10th percentile deprived areas within a single TRR.
No prior studies have compared varying SDOH area-level measures in terms of their association with key transplant outcomes and choice of index. Among the 4 deprivation indices we examined, SDI and SVI demonstrated the highest correlation, whereas ADI and SDI demonstrated the lowest correlation. This variation may be because of the intended use of or source data used to inform each index. SDI and SVI are likely highly correlated because of the 86% correlation between variables included in each index; they are also more inclined toward measuring the available resources and property characteristics through similar variables (ie, vehicle ownership, presence of crowding, and single-parent household) compared with those of other indices (ie, type of occupation and higher level education). ADI had the lowest overall correlation with the other 3 indices (SDI, 0.51; SVI, 0.54; and NDI, 0.69). The ADI includes several unique variables related to the household conditions within a geographic area and includes data on the financial strain with a higher degree of specificity (e.g., years of education, age in employment/unemployment, and 150% poverty threshold). The ADI also does not include the percent of minoritized individual or any component addressing language ability within a community. The difference in source data is not necessarily a marker of index quality but may be because of the differences in the intended use. ADI, NDI, and SDI have similar reasons for intended use, which is to quantify the level of disadvantage in a given community by exploring the variations of socioeconomic status.34–36 The intended use of SVI varies slightly in that it specifically aims to identify low-resourced communities to support them in case of a hazardous event.37
In applying the deprivation indices to patients listed for an organ transplant, all 4 indices identified a wide range of extent of deprivation across the US. However, the TRRs identified as the most deprived (75th percentile) in the US differed by choice of index. ADI identified clusters of severe deprivation in the Central Coast/Sierra Nevada regions and New England/Mid-Atlantic regions. These regions were similarly located to those indicated by NDI; however, the SDI and SVI similarly recognized clusters of moderate-to-severe deprivation in the Rocky Mountains, Great Plains/Midwest, and New England/Mid-Atlantic regions. This discordance likely stems from the varying emphasis each index places on socioeconomic factors, which may or may not be appropriate in a given geographic context. For example, ADI uniquely considers the presence of income disparity, median gross rent, and median monthly mortgage. Within a single TRR (Duke Transplant Center), we examined the correlation between indices to illustrate how the choice of the index may influence which communities are identified as the most deprived within a small geographic area. A total of 26 and 17 census tracts in kidney and liver TRRs, respectively, were identified as among the top 10th percentile by at least 1 deprivation index. However, only a single census tract was among the top 10th percentile of deprived census tracts in our institutional TRR by all 4 deprivation indices.48
Community deprivation serves as an independent predictor of health distinct from individuals’ socioeconomic status. Deprivation indices can facilitate applications of research findings between similar communities and inform interventions to mitigate barriers to care that stem from the physical conditions and community resources.49–51 Several research groups have used deprivation indices to understand how community deprivation mediates inequities in access to and outcomes after organ transplant. Wadhwani et al10 have linked community deprivation with pediatric liver transplant waitlist outcomes and short and long-term outcomes after pediatric liver transplant and organ donation rates.12,14,15 Killian et al52 and Carter et al53 have similarly associated SVI with access to living donor kidney transplant. In Canada and Europe, regional-specific deprivation indices have been similarly tied to transplant access and outcomes.11,13,54,55 These studies vary in their descriptions of the choice of deprivation index. Inclusion of this rationale, including specific variables within an index that inform the research hypothesis, will facilitate accelerated progress toward defined causal pathways between social risk, built environment, and transplant-relevant outcomes. At a population level, the variation by choice of deprivation index is significant because different conclusions can be derived about the most socioeconomically disadvantaged areas in the US. This can, in turn, influence efforts to allocate resources and establish outreach programs to targeted deprived communities, which help transplant centers to increase waitlist additions and improve equity in access to transplants. This also impacts national transplant policy and the selection of metrics of success and risk adjustment criteria, which should consider this index-dependent variation in social risk.
Our findings prompt several considerations for researchers and health care systems considering the use of deprivation indices. First, it is important to consider the boundaries used to define each region when applying the social deprivation indices. ZIP codes are a common proxy for census tracts but were developed based on postal delivery routes and may not be adequate units of geographic analysis when attempting to describe neighborhood conditions that influence access to transplant.56–58 Because boundary designations can impact the interpretation of the results, researchers need to be mindful when defining their geographic boundaries according to the research objective, and additional attention should be given to understanding spatial heterogeneity and clustering effects of income/resources across populations within a region.58,59 Second, independent of the unit of analysis, the use of neighborhood-level data as a proxy for patient-level social risk screening can heighten the risk of ecologic fallacy in which incorrect assumptions are made about an individual based on aggregate-level information about a group.25,60 An alternative to area-level data is using patient-level data sources, including iterative self-identified SDOH screening and assessments for more specific information about individual deprivation, which may vary as individual circumstances (eg, employment and insurance) change. This poses significant obstacles for many institutions, including the cost and time required to add screening activities to an already busy clinical practice.60,61 It may also limit efforts to craft policies that may have a regional rather than a direct individual impact. Finally, although residential segregation is a key force driving inequitable resource distribution, other factors influenced by state and local policies (eg, zoning laws and tax policies) also influence geographic deprivation across geographic entities.62 The longitudinal impact and changes in these various index components over time should also be considered in future research, given the evolution of social contexts in response to policy change. As research into the association between social risk and clinical outcomes in transplant continues, it is important to keep in mind the need for the purposeful selection of composite markers of social deprivation. More work is also needed to understand the relationship between community-level and individual-level social deprivation and identify causal mechanisms that link these phenomena to clinical outcomes after transplant.
This study is not without its limitations. First, the data sources used to construct each deprivation index did not include identical calendar years. Because demographic variables may change over time, this difference in time periods may contribute to the discordance seen when applying the comparisons with TRRs. This flaw is inherent to the variation between deprivation indices and should be considered when applying findings from research using different deprivation indices within the same patient population or geographic area. Second, population counts from 2018 were used as common weights for all indices, including those from years other than 2018. These population counts were used to aggregate ADI from census block groups to census tracts in order to compare them with other deprivation indices. We did this in an effort to work with data as it is currently available to researchers, and a sensitivity analysis performed with the ADI reaggregated from the census block group to the census tract using 3 additional metrics did not change our results. Assessing correlation using TRR as a unit of geographic analysis affords advantages in interpretation but is hampered by relatively few observations and the tendency for aggregated values to mask large variances and to be clustered toward their central tendency. By contrast, utilizing the census tract-level data provides statistical advantages but is less interpretable.
6. Conclusion
We used transplant referral populations in the US to illustrate the degree of correlation between 4 commonly used deprivation indices. Although some indices were highly correlated with one another, other indices were not. Our findings highlight the need for the purposeful choice of deprivation index by health equity researchers during study design based on that target population and socioeconomic barriers of interest. Considering that each deprivation index demonstrates a broad range of deprivation across the US, albeit to different degrees, geographical-level SDOH risk data have significant value if utilized appropriately. Future work is needed to compare associations between varying manifestations of social deprivation, access to transplant, and posttransplant outcomes at the individual, center, and community levels.
Supplementary Material
Funding
Research reported in this publication was supported by the National Institute on Minority Health and Health Disparities under Award Number U54MD012530 and a Harold Amos Medical Faculty Development Award from the Robert Wood Johnson Foundation. The content is solely the responsibility of the authors and does not necessarily represent the official views of the National Institutes of Health.
Abbreviations:
- ACS
American Community Survey
- ADI
area deprivation index
- HRR
hospital referral region
- NDI
neighborhood deprivation index
- SDI
social deprivation index
- SDOH
social determinants of health
- SVI
social vulnerability index
- TRR
transplant referral region
- US
United States
- USRDS
United States Renal Database System
Footnotes
Disclosure
The authors of this manuscript have no conflicts of interest to disclose as described by the American Journal of Transplantation.
Appendix A. Supplementary data
Supplementary data to this article can be found online at https://doi.org/10.1016/j.ajt.2022.11.018.
Data availability
The data that support the findings of this study are available from the corresponding author upon request.
REFERENCES
- 1.Committee on Integrating Primary Care, Public Health; Board on Population Health. In: Public Health Practice; Institute of Medicine. Primary Care and Public Health: Exploring Integration to Improve Population Health. National Academies Press; 2012. [PubMed] [Google Scholar]
- 2.Andermann A, CLEAR Collaboration. Taking action on the social determinants of health in clinical practice: a framework for health professionals. CMAJ. 2016;188(17–18):E474–E483. 10.1503/cmaj.160177. [DOI] [PMC free article] [PubMed] [Google Scholar]
- 3.Ng YH, Pankratz VS, Leyva Y, et al. Does racial disparity in kidney transplant waitlisting persist after accounting for social determinants of health? Transplantation. 2020;104(7):1445–1455. 10.1097/TP.0000000000003002. [DOI] [PMC free article] [PubMed] [Google Scholar]
- 4.Wesselman H, Ford CG, Leyva Y, et al. Social determinants of health and race disparities in kidney transplant. Clin J Am Soc Nephrol. 2021;16(2):262–274. 10.2215/CJN.04860420. [DOI] [PMC free article] [PubMed] [Google Scholar]
- 5.Link BG, Phelan J. Social conditions as fundamental causes of disease. J Health Soc Behav. 1995:80–94. 10.2307/2626958. Spec No. [DOI] [PubMed] [Google Scholar]
- 6.Nephew LD, Serper M. Racial, gender, and socioeconomic disparities in liver transplantation. Liver Transpl. 2021;27(6):900–912. 10.1002/lt.25996. [DOI] [PubMed] [Google Scholar]
- 7.Harding JL, Perez A, Patzer RE. Nonmedical barriers to early steps in kidney transplantation among underrepresented groups in the United States. Curr Opin Organ Transplant. 2021;26(5):501–507. 10.1097/MOT.0000000000000903. [DOI] [PubMed] [Google Scholar]
- 8.Park C, Jones MM, Kaplan S, et al. A scoping review of inequities in access to organ transplant in the United States. Int J Equity Health. 2022;21(1):22. 10.1186/s12939-021-01616-x. [DOI] [PMC free article] [PubMed] [Google Scholar]
- 9.Mohottige D, McElroy LM, Boulware LE. A cascade of structural barriers contributing to racial kidney transplant inequities. Adv Chronic Kidney Dis. 2021;28(6):517–527. 10.1053/j.ackd.2021.10.009. [DOI] [PMC free article] [PubMed] [Google Scholar]
- 10.Wadhwani SI, Ge J, Gottlieb L, et al. Racial/ethnic disparities in wait-list outcomes are only partly explained by socioeconomic deprivation among children awaiting liver transplantation. Hepatology. 2022;75(1):115–124. 10.1002/hep.32106. [DOI] [PMC free article] [PubMed] [Google Scholar]
- 11.Goobie GC, Ryerson CJ, Johannson KA, et al. Neighborhood-level disadvantage impacts on patients with fibrotic interstitial lung disease. Am J Respir Crit Care Med. 2022;205(4):459–467. 10.1164/rccm.202109-2065OC. [DOI] [PubMed] [Google Scholar]
- 12.Wadhwani SI, Brokamp C, Rasnick E, Bucuvalas JC, Lai JC, Beck AF. Neighborhood socioeconomic deprivation, racial segregation, and organ donation across 5 states. Am J Transplant. 2021;21(3):1206–1214. 10.1111/ajt.16186. [DOI] [PMC free article] [PubMed] [Google Scholar]
- 13.Menahem B, Dejardin O, Alves A, et al. Socioeconomic deprivation does not impact liver transplantation outcome for HCC: a survival analysis from a national database. Transplantation. 2021;105(5):1061–1068. 10.1097/TP.0000000000003340. [DOI] [PubMed] [Google Scholar]
- 14.Wadhwani SI, Bucuvalas JC, Brokamp C, et al. Association between neighborhood-level socioeconomic deprivation and the medication level variability index for children following liver transplantation. Transplantation. 2020;104(11):2346–2353. 10.1097/TP.0000000000003157. [DOI] [PMC free article] [PubMed] [Google Scholar]
- 15.Wadhwani SI, Beck AF, Bucuvalas J, Gottlieb L, Kotagal U, Lai JC. Neighborhood socioeconomic deprivation is associated with worse patient and graft survival following pediatric liver transplantation. Am J Transplant. 2020;20(6):1597–1605. 10.1111/ajt.15786. [DOI] [PMC free article] [PubMed] [Google Scholar]
- 16.Begaj I, Khosla S, Ray D, Sharif A. Socioeconomic deprivation is independently associated with mortality post kidney transplantation. Kidney Int. 2013;84(4): 803–809. 10.1038/ki.2013.176. [DOI] [PubMed] [Google Scholar]
- 17.Flemming JA, Muaddi H, Djerboua M, Neves P, Sapisochin G, Selzner N. Association between social determinants of health and rates of liver transplantation in individuals with cirrhosis. Hepatology. 2022;76(4):1079–1089. 10.1002/hep.32469. [DOI] [PubMed] [Google Scholar]
- 18.United Network for Organ Sharing. UNOS to study data collection related to social determinants of health. Accessed January 20, 2022. https://unos.org/news/sdoh-data-collection/.
- 19.Rosenblatt R, Lee H, Liapakis A, et al. Equitable access to liver transplant: bridging the gaps in the social determinants of health. Hepatology. 2021;74(5):2808–2812. 10.1002/hep.31986. [DOI] [PubMed] [Google Scholar]
- 20.Lombardi C, Glosser L, Knauss H, Norwood T, Berry J, Ekwenna O. Impact of social determinants of health on chronic kidney disease: a review of disparities in renal transplantation: socioeconomic impact on kidney transplant. Transl Univ Toledo J Med Sci. 2021;9(1). 10.46570/utjms.vol9-2021-515. [DOI] [Google Scholar]
- 21.Mansour MM, Fard D, Basida SD, et al. Disparities in social determinants of health among patients receiving liver transplant: analysis of the national inpatient sample from 2016 to 2019. Cureus. 2022. Jul 5;14(7), e26567. 10.7759/cureus.26567. eCollection 2022 Jul; [DOI] [PMC free article] [PubMed] [Google Scholar]
- 22.Johnson WR, Rega SA, Feurer ID, Karp SJ. Associations between social determinants of health and abdominal solid organ transplant wait-lists in the United States. Clin Transplant. 2022;36(11), e14784. 10.1111/ctr.14784. [DOI] [PubMed] [Google Scholar]
- 23.Brown JS, O’Brien T. Assessing and addressing fundamentals of social determinants of health factors in kidney transplant candidates and recipients. Nephrol Nurs J. 2022; 49(4):345–349. 10.37526/1526-744X.2022.49.4.345. [DOI] [PubMed] [Google Scholar]
- 24.Bazemore AW, Cottrell EK, Gold R, et al. Community vital signs”: incorporating geocoded social determinants into electronic records to promote patient and population health. J Am Med Inform Assoc. 2016;23(2):407–412. 10.1093/jamia/ocv088. [DOI] [PubMed] [Google Scholar]
- 25.Phillips RL, Liaw W, Crampton P, et al. How other countries use deprivation indices—and why the United States desperately needs one. Health Aff (Millwood). 2016;35(11):1991–1998. 10.1377/hlthaff.2016.0709. [DOI] [PubMed] [Google Scholar]
- 26.Boscoe FP, Liu B, Lee F. A comparison of two neighborhood-level socioeconomic indexes in the United States. Spat Spatiotemporal Epidemiol. 2021;37, 100412. 10.1016/j.sste.2021.100412. [DOI] [PubMed] [Google Scholar]
- 27.Peipert JD, Beaumont JL, Robbins ML, et al. Development and validation of a socioeconomic kidney transplant derailers index. Transplant Direct. 2019;5(11):e497. 10.1097/TXD.0000000000000927. [DOI] [PMC free article] [PubMed] [Google Scholar]
- 28.Health Resources and Services Administration. Organ donation and transplantation. Accessed August 18, 2021. https://data.hrsa.gov//DataDownload/DD_Files/ORG_OTC_FCT_DET.xlsx.
- 29.Dartmouth health atlas. Geographic Boundary Files, HRR Boundaries. Accessed March 3, 2021. https://data.dartmouthatlas.org/downloads/geography/HRR_Bdry_AK_HI_unmodified.zip.
- 30.Dartmouth health atlas. ZIP code crosswalks. Updated https://data.dartmouthatlas.org/downloads/geography/ZipHsaHrr18.csv.zip; 2018. Accessed March 3, 2021.
- 31.United States Census Bureau. TIGER/Line shapefiles; 2018. https://www.census.gov/geographies/mapping-files/time-series/geo/tiger-line-file.2018.html. Accessed February 7, 2022.
- 32.Walker K Tigris: Load Census TIGER. Line Shapefiles; 2021. [Google Scholar]
- 33.Glenn EH. Package ‘acs’. Download, Manipulate, and Present American Community Survey and Decennial Data from the US Census. 2019. [Google Scholar]
- 34.Neighborhood. Atlas Press. https://www.neighborhoodatlas.medicine.wisc.edu/. [Google Scholar]
- 35.Center RG. Social Deprivation Index (SDI). [Google Scholar]
- 36.Diez Roux AV. Mair C. Neighborhoods and health. Ann N Y Acad Sci. 2010;1186: 125–145. 10.1111/j.1749-6632.2009.05333.x. [DOI] [PubMed] [Google Scholar]
- 37.Flanagan BE, Hallisey EJ, Adams E, Lavery A. Measuring community vulnerability to natural and anthropogenic hazards: the Centers for Disease Control and Prevention’s social vulnerability index. J Environ Health. 2018;80(10):34–36. [PMC free article] [PubMed] [Google Scholar]
- 38.Ross-Driscoll K, Axelrod D, Lynch R, Patzer RE. Using geographic catchment areas to measure population-based access to kidney transplant in the United States. Transplantation. 2020;104(12):e342–e350. 10.1097/TP.0000000000003369. [DOI] [PubMed] [Google Scholar]
- 39.Pebesma E Simple features for R: standardized support for spatial vector data. R J. 2018;10(1):439–446. 10.32614/RJ-2018-009. [DOI] [Google Scholar]
- 40.System USRD. Researcher’s Guide to the USRDS Database; 2018. https://www.usrds.org/media/2178/2018_usrds_researcher_guid.pdf. Accessed 1 July 2021.
- 41.Dunnington D, Pebesma E, Rubak E. S2: Spherical Geometry Operators Using the S2. Geometry Library; 2021. [Google Scholar]
- 42.Schappe T, Peskoe S, Bhavsar N, Boulware LE, Pendergast J, McElroy LM. Geospatial analysis of organ transplant referral regions. JAMA Netw Open. 2022;5(9), e2231863. 10.1001/jamanetworkopen.2022.31863. [DOI] [PMC free article] [PubMed] [Google Scholar]
- 43.Core Team R. R: A Language and Environment for Statistical Computing. R Foundation for Statistical Computing; 2021. [Google Scholar]
- 44.Goldfarb-Rumyantzev AS, Koford JK, Baird BC, et al. Role of socioeconomic status in kidney transplant outcome. Clin J Am Soc Nephrol. 2006;1(2):313–322. 10.2215/CJN.00630805. [DOI] [PubMed] [Google Scholar]
- 45.Goldfarb-Rumyantzev AS, Sandhu GS, Baird B, et al. Effect of education on racial disparities in access to kidney transplantation. Clin Transplant. 2012;26(1):74–81. 10.1111/j.1399-0012.2010.01390.x. [DOI] [PubMed] [Google Scholar]
- 46.Patzer RE, Amaral S, Wasse H, Volkova N, Kleinbaum D, McClellan WM. Neighborhood poverty and racial disparities in kidney transplant waitlisting. J Am Soc Nephrol. 2009;20(6):1333–1340. 10.1681/ASN.2008030335. [DOI] [PMC free article] [PubMed] [Google Scholar]
- 47.Saunders MR, Cagney KA, Ross LF, Alexander GC. Neighborhood poverty, racial composition and renal transplant waitlist. Am J Transplant. 2010;10(8):1912–1917. 10.1111/j.1600-6143.2010.03206.x. [DOI] [PubMed] [Google Scholar]
- 48.Bureau USC. American Community Survey (ACS). https://www.census.gov/programs-surveys/acs. Accessed 1 July 2021.
- 49.Brown TJ, Todd A, O’Malley CL, et al. Community pharmacy interventions for public health priorities: a systematic review of community pharmacy-delivered smoking, alcohol and weight management interventions. Public Health Res. 2016;4(2):1–162. 10.3310/phr04020. [DOI] [PubMed] [Google Scholar]
- 50.Dyson L, McCormick F, Entwistle F, Duncan H, Chaplin S, Renfrew MJ. Mapping breastfeeding services: a method to inform effective implementation and evaluation of evidence-based policy in practice. Matern Child Nutr. 2014;10(2):253–266. 10.1111/j.1740-8709.2012.00408.x. [DOI] [PMC free article] [PubMed] [Google Scholar]
- 51.Ellis S, Geana M, Griebling T, et al. Development, acceptability, appropriateness and appeal of a cancer clinical trials implementation intervention for rural- and minority-serving urology practices. Trials. 2019;20(1):578. 10.1186/s13063-019-3658-z. [DOI] [PMC free article] [PubMed] [Google Scholar]
- 52.Killian AC, Shelton B, MacLennan P, et al. Evaluation of community-level vulnerability and racial disparities in living donor kidney transplant. JAMA Surg. 2021;156(12):1120–1129. 10.1001/jamasurg.2021.4410. [DOI] [PMC free article] [PubMed] [Google Scholar]
- 53.Carter AJ, Reed RD, Kale AC, et al. Impact of social vulnerability on access to educational programming designed to enhance living donation. Prog Transplant. 2021;31(4):305–313. 10.1177/15269248211046014. [DOI] [PubMed] [Google Scholar]
- 54.Driollet B, Bayer F, Kwon T, et al. Social deprivation is associated with lower access to pre-emptive kidney transplantation and more urgent-start dialysis in the pediatric population. Kidney Int Rep. 2022;7(4):741–751. 10.1016/j.ekir.2021.12.015. [DOI] [PMC free article] [PubMed] [Google Scholar]
- 55.Calvar E, Launay L, Boyer A, Launoy G, Lobbedez T, Châtelet V. Effects of social deprivation on the proportion of preemptive kidney transplantation: A mediation analysis. Transplant Direct. 2021;7(10), e750. 10.1097/TXD.0000000000001203. [DOI] [PMC free article] [PubMed] [Google Scholar]
- 56.Krieger N, Chen JT, Waterman PD, Rehkopf DH, Subramanian SV. Race/ethnicity, gender, and monitoring socioeconomic gradients in health: a comparison of area-based socioeconomic measures—the public health disparities geocoding project. Am J Public Health. 2003;93(10):1655–1671. 10.2105/ajph.9310.1655. [DOI] [PMC free article] [PubMed] [Google Scholar]
- 57.Krieger N, Waterman P, Chen JT, Soobader MJ, Subramanian SV, Carson R. ZIP code caveat: bias due to spatiotemporal mismatches between ZIP codes and US census-defined geographic areas—the Public Health Disparities Geocoding Project. Am J Public Health. 2002;92(7):1100–1102. 10.2105/ajph.92.7.1100. [DOI] [PMC free article] [PubMed] [Google Scholar]
- 58.Krieger N, Waterman PD, Spasojevic J, Li W, Maduro G, Van Wye G. Public health monitoring of privilege and deprivation with the index of concentration at the extremes. Am J Public Health. 2016;106(2):256–263. 10.2105/AJPH.2015.302955. [DOI] [PMC free article] [PubMed] [Google Scholar]
- 59.Fotheringham AS, Wong DWS. The modifiable areal unit problem in multivariate statistical analysis. Environ Plan A. 1991;23(7):1025–1044. 10.1068/a231025. [DOI] [Google Scholar]
- 60.Gottlieb LM, Francis DE, Beck AF. Uses and misuses of patient- and neighborhood-level social determinants of health data. Perm J. 2018;22:18–78. 10.7812/TPP/18-078. [DOI] [PMC free article] [PubMed] [Google Scholar]
- 61.Cottrell EK, Hendricks M, Dambrun K, et al. Comparison of community-level and patient-level social risk data in a network of community health centers. JAMA Netw Open. 2020;3(10), e2016852. 10.1001/jamanetworkopen.2020.16852. [DOI] [PMC free article] [PubMed] [Google Scholar]
- 62.The root causes of health inequity. Commun Action Pathw Health Equity; 2017. [Google Scholar]
Associated Data
This section collects any data citations, data availability statements, or supplementary materials included in this article.
Supplementary Materials
Data Availability Statement
The data that support the findings of this study are available from the corresponding author upon request.


