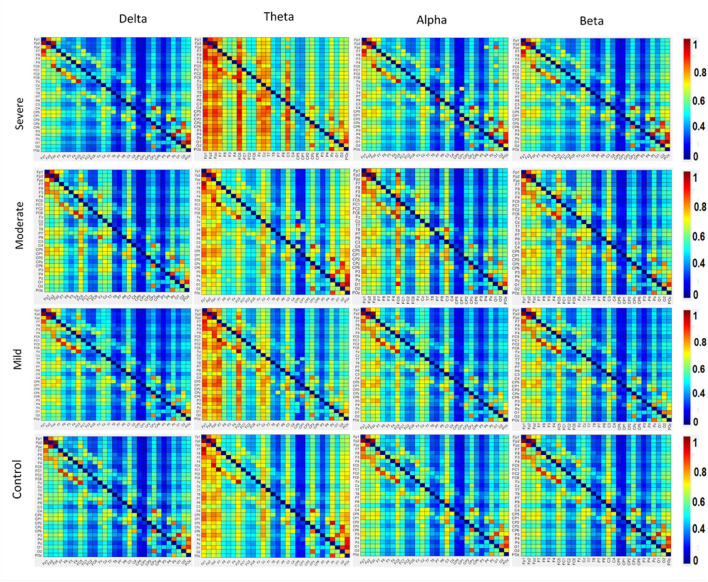
Figure 4.
The averaged resting-state PDC intensity of the brain's neuronal clusters. Each element in the matrix represents the mean PDC magnitude between two regions for the SAD groups. The flow of information can be visualized by the direction from the lower rows to the left columns. The red color of the component indicates a greater flow of information between the nodes. The diagonal values are set to zero. All electrodes are in the order of this arrangement: FP1, FP2, FPz, F7, F8, F3, F4, FC5, FC1, FC2, FC6, Fz, Cz, T8, P7, P8, C3, C4, C3, CP2, CP4, CP1, CP6, CP5, P3, P4, Pz, O1, O2, and Poz.

