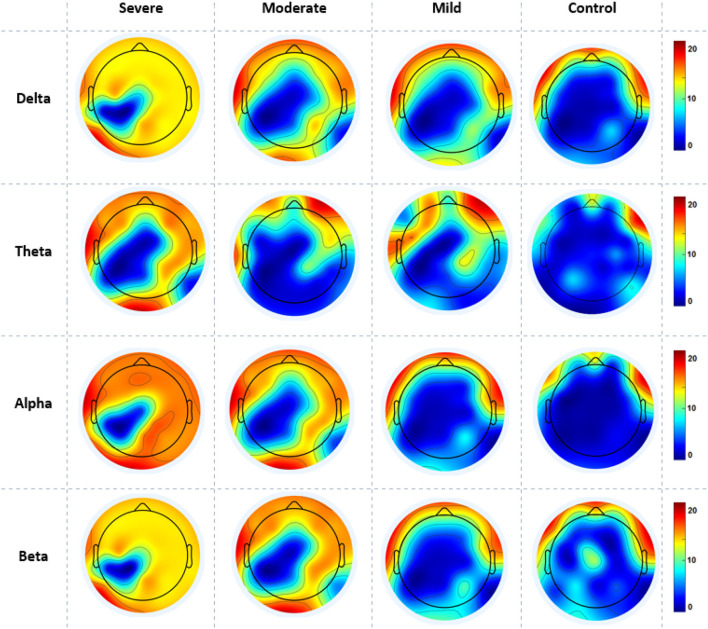
Figure 5.
A mean nodal degree in resting-state for all SAD groups (severe, moderate, mild, and HCs) and frequencies (delta, theta, alpha, and beta). Red color indicate higher nodal degree; White color indicate lower nodal degree. The topographic maps were created with EEGLAB function (the venerable topoplot). This includes a 2D grid representation of the scalp and nodal degree values as color-coded dots or contours at the corresponding scalp locations (10-20 system).

