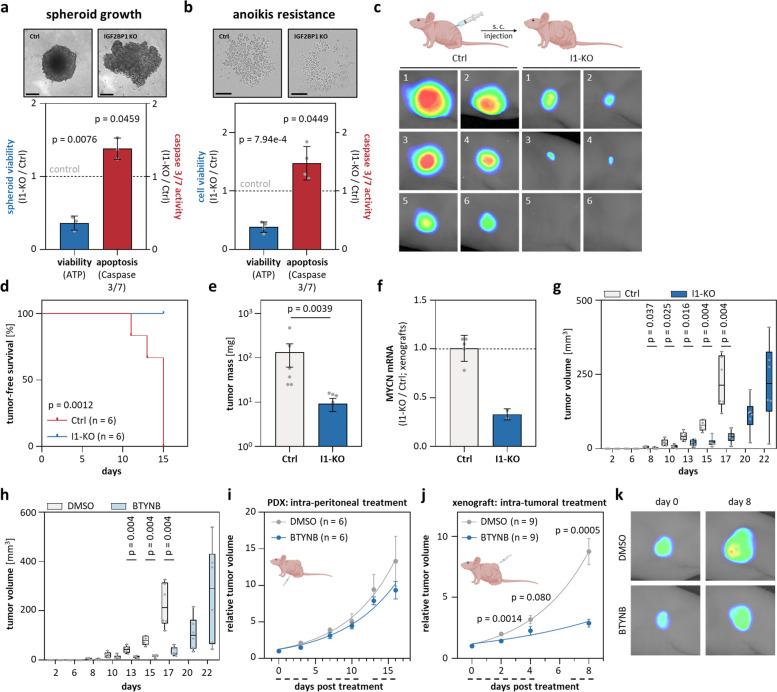
Fig. 3.
IGF2BP1 deletion and inhibition by BTNYB impairs xenograft tumor growth. a, b The viability and caspase3/7-activity of parental (Ctrl) and I1-KO BE(2)-C was analyzed in spheroid growth (a, n = 3) and anoikis-resistance studies (b, n = 4; bars a, 200 µm and b, 400 µm). c-e Tumor growth (n = 6) of Ctrl and I1-KO BE(2)-C s.c. xenografts was monitored by non-invasive infrared imaging (c), tumor-free survival (d) and final tumor mass (e). f RT-qPCR analysis of MYCN mRNA levels in excised xenograft tumors and non-palpable tumor cell mass upon I1-KO (Ctrl, n = 5; I1-KO, n = 2). g, h Tumor growth (n = 6) of Ctrl and I1-KO (g) or DMSO- and BTYNB-pretreated (h) BE(2)-C xenografts was monitored by tumor volume over time. i Tumor growth (n = 6) was monitored by relative volume of s.c. PDX tumors treated i.p. with DMSO (grey) or BTYNB (blue). Daily treatment in three cycles is indicated by dashed lines below the x-axis. j Tumor growth (n = 9) was monitored by relative volume of s.c. BE(2)-C treated i.t. with DMSO (grey) or 50 mg/kg BW BTYNB (blue). Daily treatment in two cycles is indicated by dashed lines below the x-axis. k Representative images of tumors at start (day 0) and final treatment (day 8)

