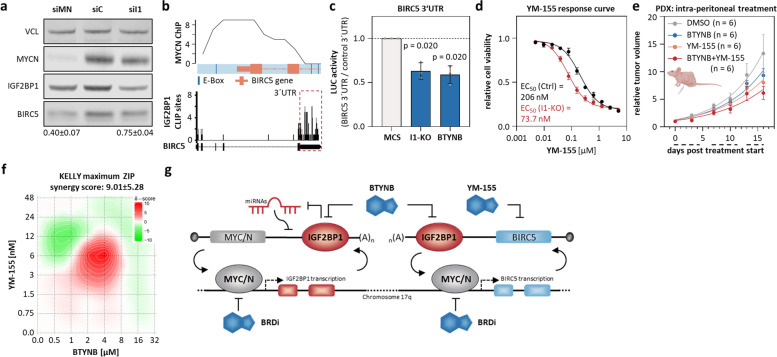
Fig. 5.
MYCN/IGF2BP1 feedforward regulation promotes expression of druggable oncogenes located on Chr 17q. a Western blot analysis of BIRC5 expression upon MYCN (siMN) or IGF2BP1 (siI1) compared to control (siC) knockdown in BE(2)-C (n = 3). b MYCN ChIP-seq profile of the BIRC5 promoter region (upper panel) and IGF2BP1-CLIP profile for the BIRC5 mRNA (lower panel). c BIRC5 3´UTR luciferase activity in I1-KO versus parental (Ctrl) and BTYNB- versus DMSO-treated BE(2)-C (n = 3). d YM-155 response curve in control (black) and I1-KO (red) BE(2)-C (n = 4). e Tumor growth (n = 6) was monitored by relative volume of s.c. PDX tumors treated i.p. with DMSO (grey), YM-155 (orange) or in combination of YM-155 and BTYNB (red). Daily treatment in three cycles is indicated by dashed lines below the x-axis. f Relief plot showing the ZIP synergy for combined treatment of BTYNB and YM-155 in KELLY (n = 3). g Scheme of transcriptional/post-transcriptional feedback regulation of MYC/N, IGF2BP1 and downstream effectors as well as treatment possibilities

