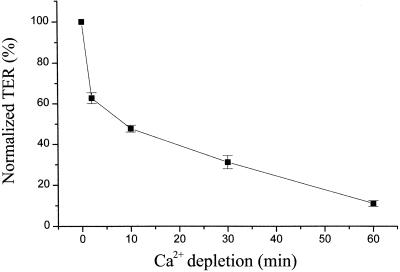
Figure 2.
TER measurements during Ca2+ depletion. TER was measured at 0, 2, 10, 30, and 60 min after cells were switched from Ca2+-containing medium to the medium without Ca2+. Each TER measurement was normalized to the TER value before switching to the Ca2+-free medium and was obtained after background subtraction (contributed by the filter and bath solution). The data represent the average ± SE from five experiments.

