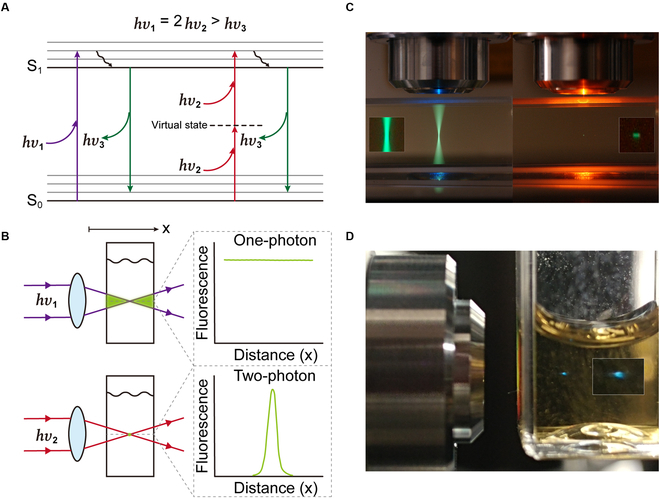
Fig. 5.

2PEF vs 1PEF. (A) A Jablonski diagram for 2PEF and 1PEF. (B) Schematic comparison of 2P and 1P excitation. (C) Real-world comparison of 2P and 1P excitation. The cuvette was filled with a fluorescein solution. The whole light path exhibits bright emission under 1P excitation (left), while confined 2P excitation results in a small-dot area of emission (right). Reprinted with permission from Dr. Steve Ruzin and Ms. Holly Aaron, UC Berkeley. (D) An image of 2PFE from CA-Ser solution (under focused 800-nm 100-fs pulsed laser excitation).
