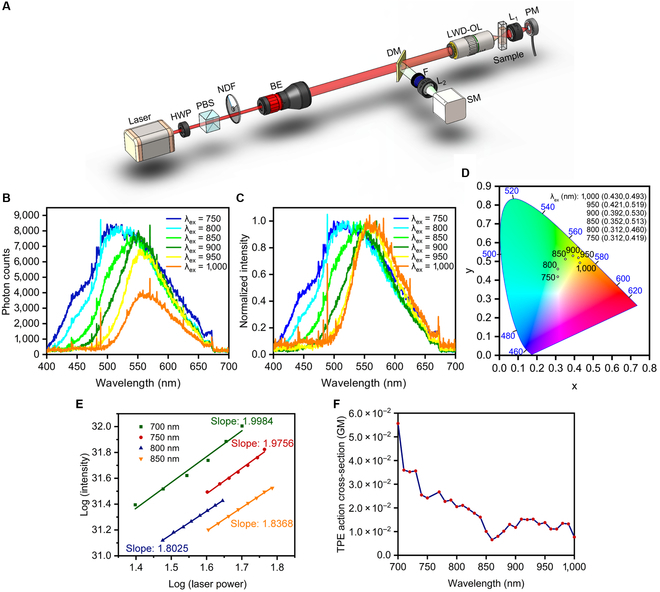
Fig. 6.

Two-photon characterizations of CA-Ser-Urea. (A) Schematic of the experimental setup (HWP, half-wave plate; PBS, polarized beam splitter; NDF, neutral density filter; BE, beam expander; DM, dichroic mirror; F, filter; L, lens; SM, spectrometer; LWD-OL, long working distance objective lens; PM, power meter). (B) 2PEF emission spectra under 750-, 800-, 850-, 900-, 950-, and 1,000-nm 2P excitations. (C) Normalized 2PEF emission spectra under 750-, 800-, 850-, 900-, 950-, and 1,000-nm 2P excitations. (D)The CIE 1931 chromaticity diagrams with coordinates under different 2P excitation wavelengths. (E) Plot of emission intensity vs excitation laser power in logarithmic scale. (F) Plot of 2-photon excitation action cross-section at different wavelengths.
