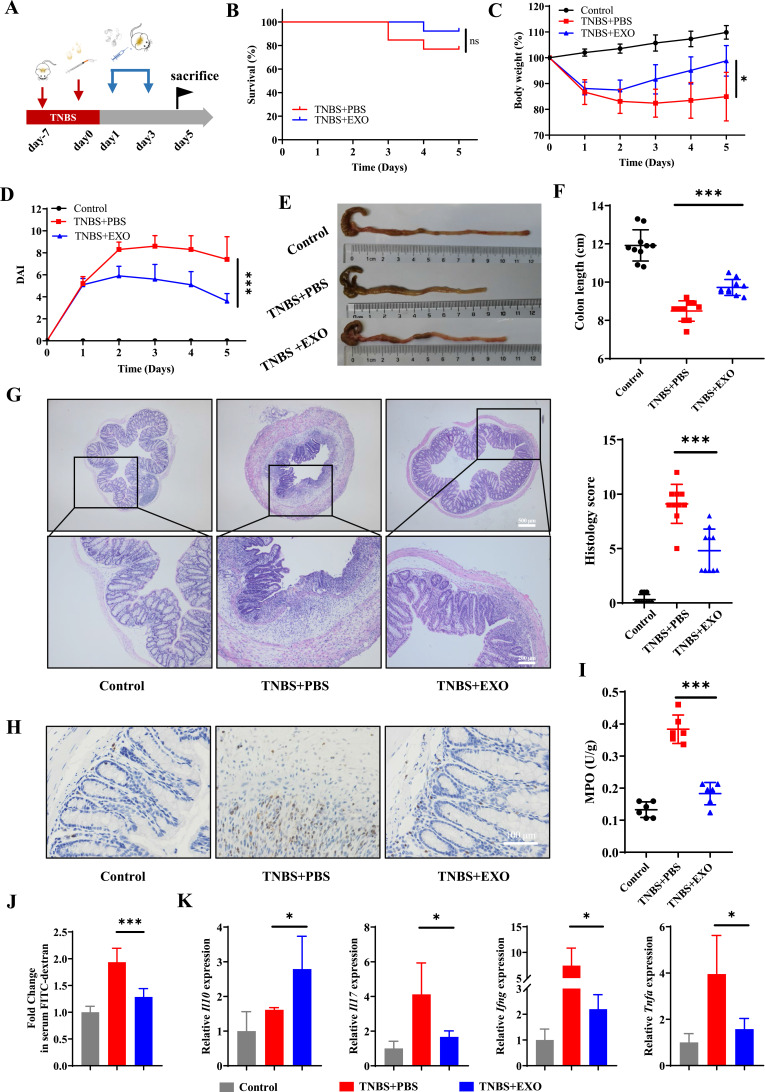
Figure 2.
HucMSC-exo accelerated mucosal healing in TNBS-induced colitis mice. (A) Schematic diagram for the construction of TNBS-induced colitis model and hucMSC-exo treatment. (B) The survival curves of mice in TNBS-induced colitis (n=13). (C) Changes in mice weight (n=10). (D) DAI scores of mice (n=10). (E) Macroscopic images of colon tissues. (F) Colon length in different groups (n=10). (G) H&E staining and histological scores of mice colon sections in TNBS-induced colitis model (n=10, scale bar=500 µm, 40×; scale bar=200 µm, 100×). (H) The neutrophil infiltration in colon tissues measured by IHC staining of MPO (n=5, scale bar=100 µm, 400×). (I) MPO activity in colon tissues evaluated by colorimetry (n=6). (J) Fold change in serum FITC-dextran between each group showing the intestinal permeability (n=6). (K) mRNA levels of Il10, Il17, Ifng and Tnfa in colon tissues estimated by real-time PCR (n=5). Data are presented as mean ± SD. Mouse survival curves were plotted by the Kaplan–Meier method and analyzed by Log rank test. The Mann–Whitney U-test (non-normal distribution) or Unpaired Student’s t-test (normal distribution) was used to compare the variables between two groups. P<0.05 was considered as statistically significant. *P<0.05 ***P<0.001 and ns indicates P>0.05.

