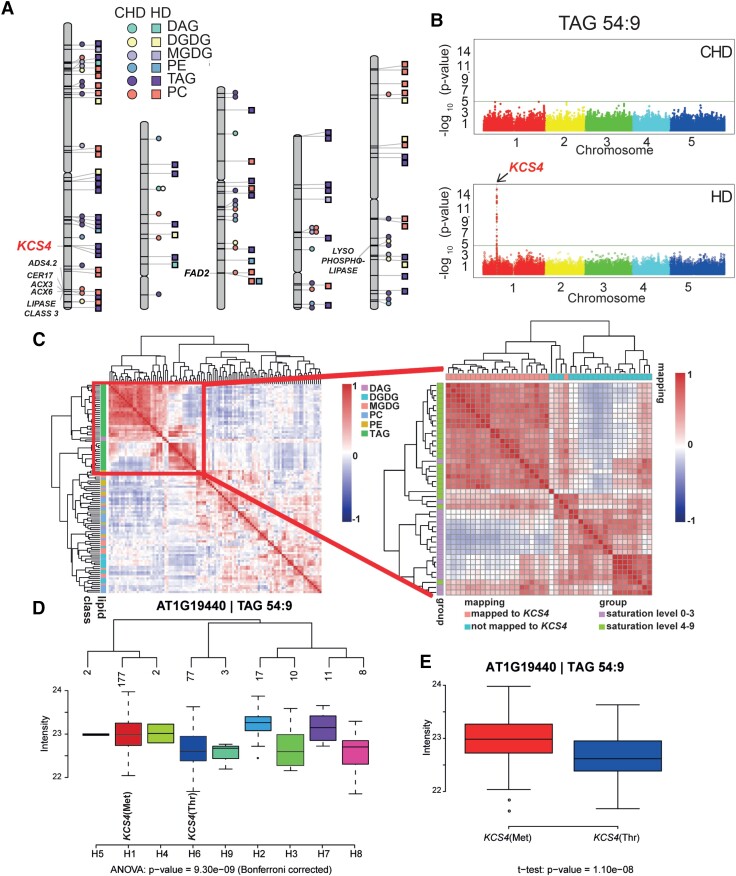
Figure 1.
Results from GWAS analysis on lipidomic data from plants grown under control (CHD) and stress (HD) conditions. A) Chromosome scheme and QTL identified in the 2 experimental conditions (CHD = circles, HD = squares), for different lipid classes: phosphatidylethanolamine (PE), phosphatidylcholine (lecithin) (PC), MGDG, DGDG, diacylglycerol (DAG), and triacylglycerol (TAG). Color/shape references are included in the figure. Gene names are included only for colocalizing QTL for 2 or more lipid species with LOD > 5.3. B) Manhattan plots obtained for TAG 54:9 in CHD (top) and in HD (bottom). The KCS4 (AT1G19440) QTL was found at Chromosome 1 only under HD condition. C) Pearson correlations coefficients calculated between all lipid species across all accessions, for HD condition. Lipids are color-coded according to class (see reference at right) and clustered using Ward’s distance on pairwise dissimilarity. A zoom-in of the TAG cluster shows the grouping pattern of TAGs according to the number of unsaturated bonds and to the GWAS result (left). D) Average trait value (intensity of TAG 54:9, log2 scale) for the different KCS4 haplotypes using SNPs m11502, m11503, m11504, and m11505. The 2 major haplotypes have the alternative alleles for m11503 (Met or Thr) E. TAG 54:9 is the average value for accessions carrying the KCS4(Met) (left) and KCS4(Thr) (right) alleles.

