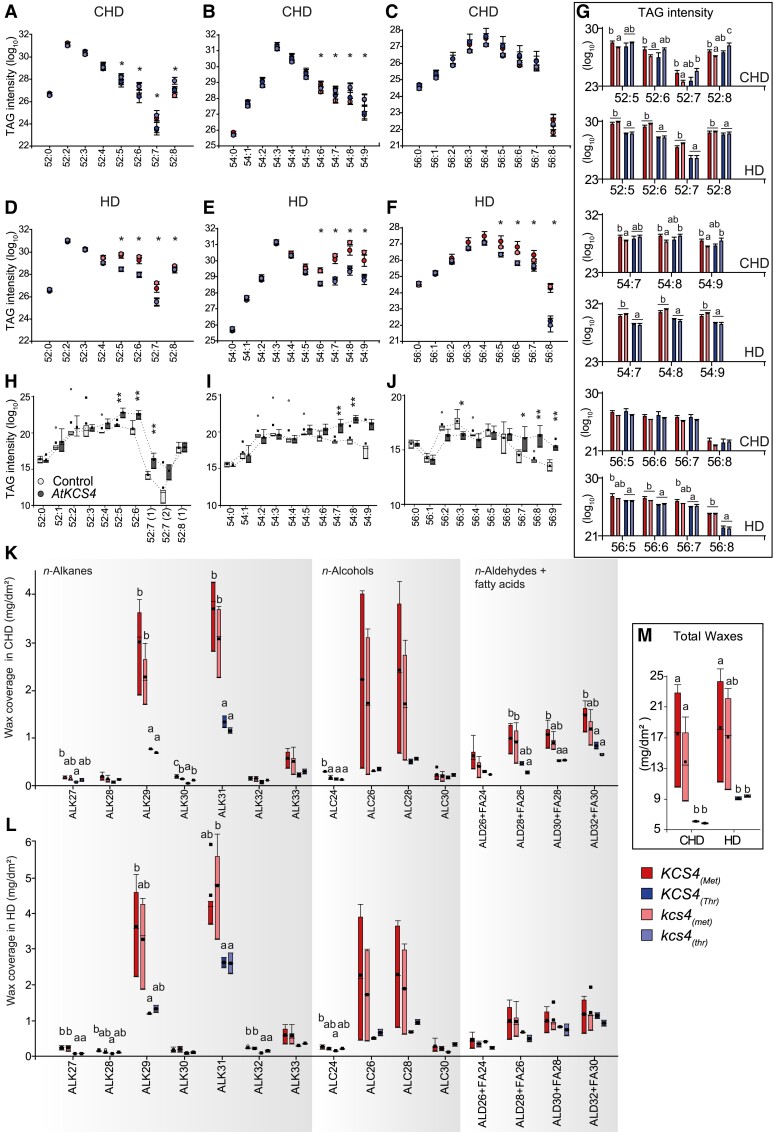
Figure 4.
KCS4 functional validation using allelic mutants in Arabidopsis and heterologous expression in N. benthamiana.A–G) Average TAG profiles for wild-type (WT) accessions and allelic mutants carrying the KCS4(Met) allele (WT: red; mutant: pink) and the KCS4(Thr) allele (WT: blue; mutant: light-blue) in CHD and HD conditions. Dot plots (A–F) and bars (G) represent means ± Se, n = 14 to 25. One-way ANOVA followed by Fisher-Lsd post hoc test was performed to detect differences between lines for each TAG species. Significant changes (P < 0.05) are marked with asterisks (A–F) or different letters (G). H–J) Transient expression of AtKCS4(Met) in N. benthamiana leaves. Plants were grown in CHD conditions for the whole experiment. TAG levels for classes 52 (52:0 to 52:8), 54 (54:0 to 54:9) and 56 (56:0 to 56:0) for the control line (white) and for the AtKCS4(Met) line (dark grey). Box-plots (n = 3). Significant values (t-test) are indicated (*P < 0.05, **P < 0.01). K–M) Leaf cuticular wax coverage for WT accessions and allelic mutants carrying the KCS4(Met) allele (WT: red; mutant: pink) and the KCS4(Thr) allele (WT: blue; mutant: light-blue) in CHD and HD conditions. ALK: alkane, ALC: alcohol, ALD: aldehyde, FA: fatty acid. Box-plots (n = 4). One-way ANOVA followed by Fisher-Lsd post hoc test was performed to detect differences between lines for each wax species. Means with a common letter are not significantly different (P < 0.05).

