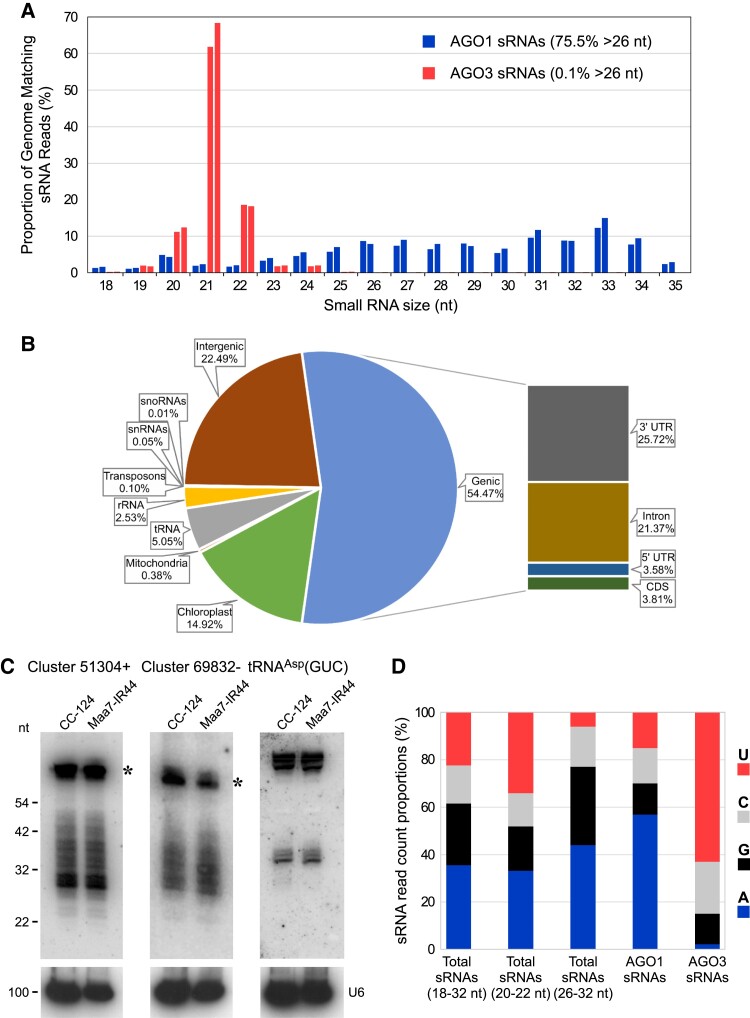
Figure 2.
AGO1-associated sRNAs in C. reinhardtii. A) Size distribution of genome-mapped AGO1-associated sRNAs (blue) and AGO3-associated sRNAs (red). Data from replicate sRNA libraries are shown as bars of the same color. B) Abundance (as % of all genome-mapped reads) of AGO1-associated redundant sRNAs matching sequences of distinct functional categories. The chloroplast fraction corresponds to tRNAs present in the chloroplast genome. C) RNA gel blot analyses of sRNAs isolated from the indicated strains and detected with probes specific for the most abundant >26-nt sRNAs of Clusters 51304+ or 69832− (Supplemental Table S3) or tRNA fragments derived from nuclear tRNAAsp(GUC). The same filters were reprobed with the U6 small nuclear RNA sequence (U6) as a control for equivalent loading of the lanes. The asterisks indicate putative RNA precursors of the >26-nt sRNAs. CC-124, wild-type strain; Maa7-IR44, CC-124 transformed with an inverted repeat (IR) transgene designed to induce RNAi of MAA7 (encoding tryptophan synthase β-subunit). D) 5′-terminal nucleotide preference of genome-mapped total sRNAs (of the indicated size fractions), AGO1-associated sRNAs and AGO3-associated sRNAs.

