Figure 2.
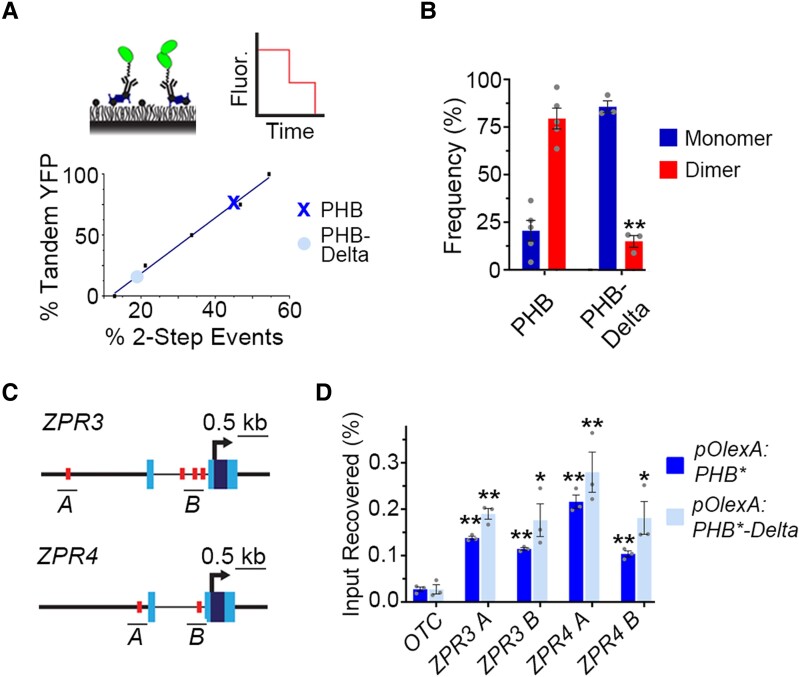
The START domain affects PHB homodimerization. A) SiMPull calibration curve (bottom graph) for monomeric vs dimeric YFP (top left cartoon) translates percentage of two-step photobleaching events (simulated in top right cartoon) to frequency of dimers in the population. PHB (X) and PHB-Delta (●) show two-step photobleaching events of 47% and 20%, respectively. B) Percentages of two-step photobleaching events translate to dimerization frequencies of ∼80% for PHB and ∼15% for PHB-Delta. C) Schematic representations of ZPR3 and ZPR4 showing HD-ZIPIII binding sites identified by FIMO (red boxes), ChIP amplicons (black bars), transcription start sites (arrow), untranslated regions (light-blue boxes), and exons (dark-blue boxes). D) PHB and PHB-Delta occupy multiple sites in the regulatory regions of ZPR3 and ZPR4 and are significantly enriched over the ORNITHINE TRANSCARBAMYLASE (OTC) negative control locus. n = 3 biological replicates. *P ≤ 0.05, **P ≤ 0.01, Student's t-test.

