Figure 6.
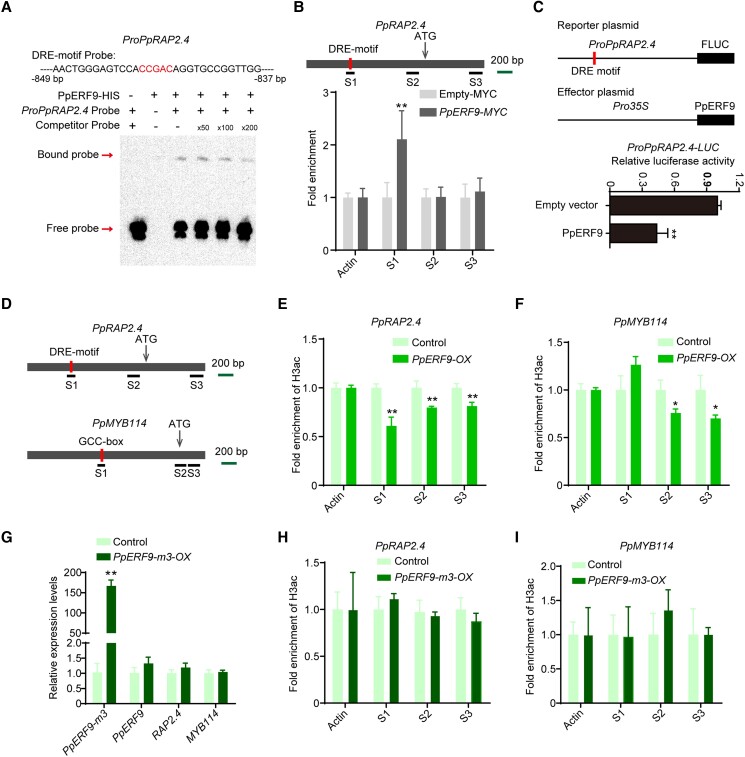
PpERF9 represses PpRAP2.4 transcription and the suppressive effect of PpERF9 on anthocyanin biosynthesis depends on histone deacetylation. A) An EMSA indicated that PpERF9 can bind directly to the PpRAP2.4 promoter. The hot probe was a biotin-labeled fragment of the PpRAP2.4 promoter containing the DRE motif, whereas the competitor probe was an unlabeled probe (50-, 100-, and 200-fold molar excess). The His-tagged PpRAP2.4 protein was purified. B) A ChIP-qPCR assay revealed the in vivo binding of PpERF9 to the PpRAP2.4 promoter. Cross-linked chromatin samples were extracted from PpERF9-MYC-overexpressing pear calli and then precipitated with an anti-MYC antibody. Eluted DNA was used to amplify the sequences surrounding the binding site by qPCR. Three regions (S1 to S3) were examined. Pear calli overexpressing the empty-MYC sequence were used as the negative control. The ChIP assay was repeated 3 times, and the enriched DNA fragments in each ChIP were used as 1 biological replicate for the qPCR. C) A dual-luciferase assay demonstrated that PpERF9 directly inhibits PpRAP2.4 promoter activity in vivo. D) Schematic diagram of the primers used in the ChIP-qPCR assay. E) ChIP-qPCR results reflecting the H3ac levels at the PpRAP2.4 locus in control and PpERF9-OX pear calli. F) ChIP-qPCR results reflecting the H3ac levels at the PpMYB114 locus in control and PpERF9-OX pear calli. G) Expression levels of PpERF9-m3, PpERF9, PpRAP2.4, and PpMYB114 in PpERF9-m3-OX pear calli and control pear calli after light treatment. Pear calli were incubated under strong light at 17°C for 5 d. H) ChIP-qPCR results reflecting the H3ac levels at the PpRAP2.4 locus in control and PpERF9-m3-OX pear calli. I) ChIP-qPCR results reflecting the H3ac levels at the PpMYB114 locus in control and PpERF9-m3-OX pear calli. Cross-linked chromatin samples were extracted from control, PpERF9-OX and PpERF9-m3-OX pear calli and then precipitated with an anti-H3ac antibody. Error bars represent the standard deviation of 3 biological replicates. Asterisks indicate significantly different values (*P < 0.05 and **P < 0.01).

