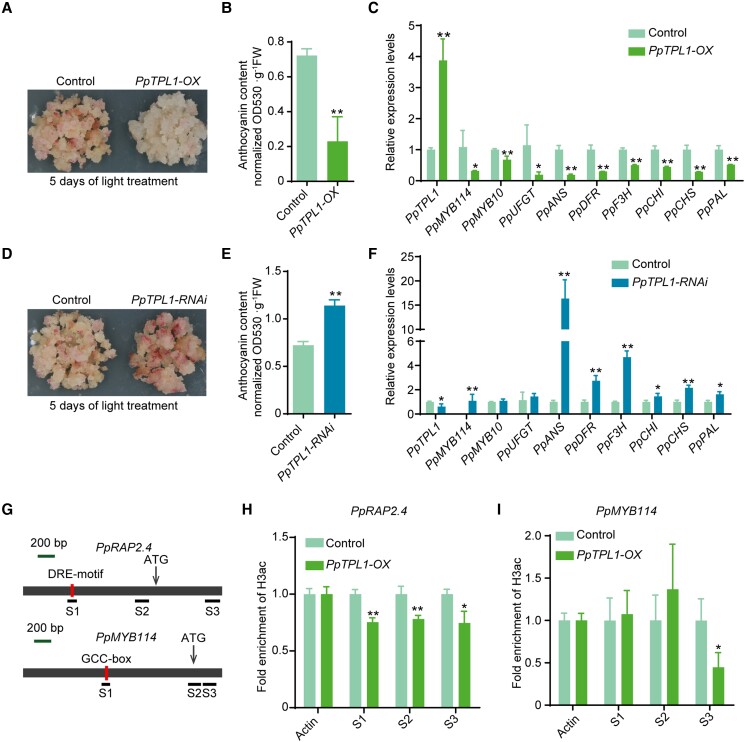
Figure 8.
Functional analysis of PpTPL1 in pear calli. A) The overexpression of PpTPL1 significantly inhibited the anthocyanin accumulation in pear calli. The calli transformed with the empty vector (pCAMBIA1301) were used as the negative control. Pear calli were incubated under strong light at 17°C for 5 d. B) Total anthocyanin contents in PpTPL1-OX pear calli after the light treatment. C) Expression levels of PpTPL1 and anthocyanin-related genes in PpTPL1-OX pear calli after the light treatment. D) The silencing of PpTPL1 induced the anthocyanin accumulation in pear calli. E) Total anthocyanin contents in PpTPL1-RNAi pear calli after the light treatment. F) Expression levels of PpTPL1 and anthocyanin-related genes in PpTPL1-RNAi pear calli after the light treatment. G) Schematic diagram of the primers used in the ChIP-qPCR assay. H) ChIP-qPCR results reflecting the H3ac levels at the PpRAP2.4 locus. I) ChIP-qPCR results reflecting the H3ac levels at the PpMYB114 locus. Cross-linked chromatin samples were extracted from PpTPL1-OX pear calli and then precipitated with an anti-H3ac antibody. Error bars represent the standard deviation of 3 biological replicates. Asterisks indicate significantly different values (*P < 0.05 and **P < 0.01).

