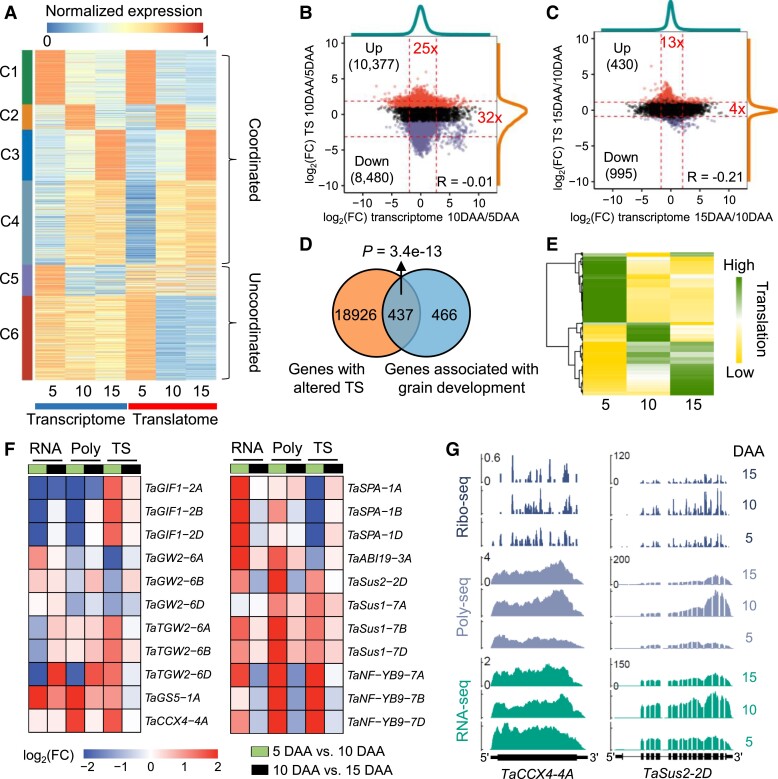
Figure 2.
Translational dynamics of gene expression during grain development. A) Coexpression of differentially expressed genes (DEGs) at the transcriptional and translational levels at 3 different grain development stages (5, 10, and 15 d after anthesis). For the transcriptome and translatome, the expression values (FPKMs) were normalized by dividing by the maximum FPKM at the transcriptional or translational level. The K-means method was employed to identify coexpression clusters. B and C) Scatterplots showing the fold changes of the translation state (TS) and transcriptional expression levels during grain development. The transitions from 5 d after anthesis (DAA) to 10 DAA B) and from 10 to 15 DAA C) were analyzed. Dashed lines represent the 2.5 and 97.5 percentiles. The fold changes of the mRNA abundance ratio B) and TS ratio C) between the 2.5 and 97.5 percentiles are indicated in red text, respectively. Red and purple points indicate genes with upregulated and downregulated TSs, respectively. D) The Venn diagram shows that most of the genes involved in grain development have an altered TS. The genes involved in grain development were taken from the literature (Yao et al. 2018; Chen et al. 2020b). P-value, hypergeometric test. E) Translational expression patterns of 437 grain development–related genes with altered TS. The Z-scores of the expression levels of each gene at the translational level were visualized. The high Z-score on the gradient scale represents the high expression levels at the translational level. F) Expression profiles of 9 functional genes. Differential expression and translation analyses were performed. G) Total mRNA (RNA-seq), polysomal mRNA (Poly-seq), and ribosome footprint (Ribo-seq) read coverage on key genes regulating wheat grain development and filling. The read coverage was normalized by the million reads mapped to nuclear coding sequences.

