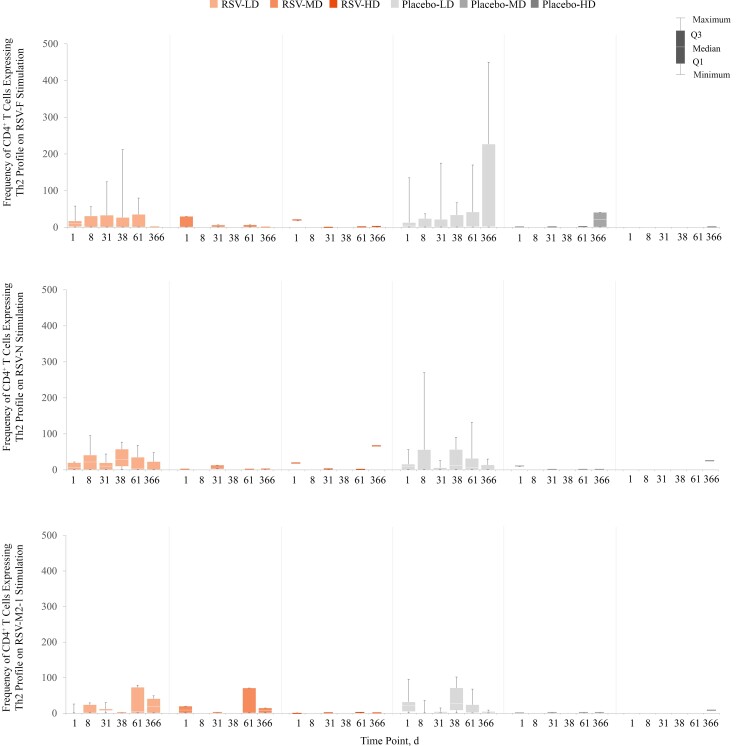
Figure 5.
Box plots of individual data for CD4+ T cells (per million CD4+ T cells) expressing T-helper 2 (Th2) profile on stimulation with respiratory syncytial virus (RSV) peptide pools (fusion [F], nucleoprotein [N], and matrix [M2-1]), through day 366 after baseline (day 1; per-protocol set). Th2 cells are CD4+ T cells expressing at least interleukin 13 but not interferon γ. Abbreviations: HD, LD, and MD, high, low, and medium dosage of the RSV investigational vaccine or placebo; Q1, quarter 1; Q3, quarter 3. Graph shows data at each time point for the following numbers of participants: RSV-LD, 3–9; RSV-MD, 0–3; RSV-HD, 0–1; placebo-LD, 4–10; placebo-MD, 0–2; placebo-HD, 0–1.

