
Figure 1:
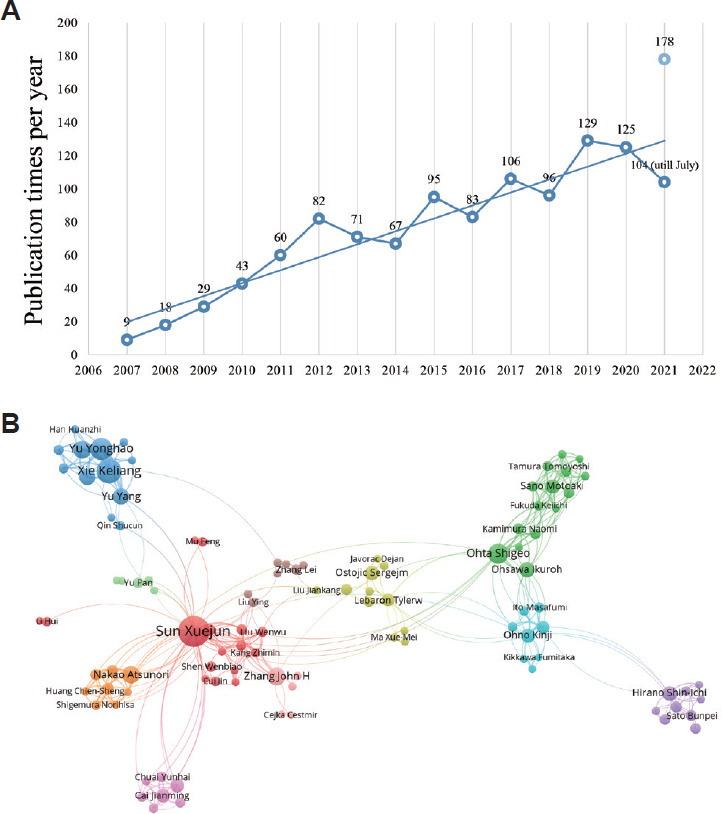
Overall research trend and author cooperation network.
Note: (A) The increasing trend of publication numbers from 2007 to 2021. The circles of each year indicated the number of publications in that year. The blue line was the regression line that indicated the upward tendency. (B) The cooperation network of the authors in this field. The size of each circle represented the number of publications published by the authors. The lines between two circles represented the cooperation between two authors.