Figure 2.
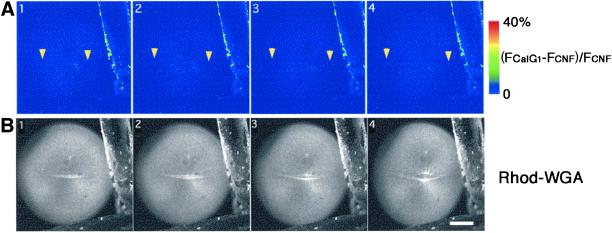
Dual time-lapse imaging of [Ca2+]i and the newly emerging cleavage furrow. (A) Time-lapse images at an interval of 90 s depict increasing fluorescence intensity of CalG-dx (increasing free [Ca2+]i: (FCalG− FCNF)/FCNF × 2.5) on a pseudocolor scale as indicated by the color bar. The positions of the growing ends in B are indicated with yellow arrowheads. Note that no obvious elevation of the free [Ca2+]i was detected at the growing end of the cleavage furrow. (B) Serial images of a newly emerging and elongating cleav-age furrow stained with rhodamine-WGA (the white line in the middle of the egg). Each image was simultaneously obtained with those shown in A. Scale bar, 0.2 mm.

