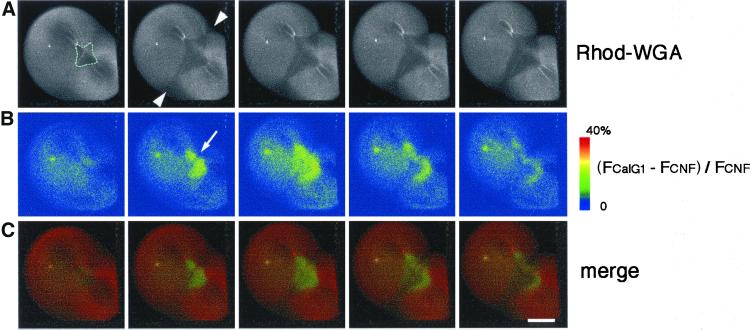
Figure 5.
Dual imaging of rhodamine-WGA staining and Ca wave 1. (A) A time-lapse recording of rhodamine-WGA staining of the egg surface during furrow deepening at 2-min intervals. The region where the membrane is newly inserted appears as a dark region (the area encircled by a dotted line). The arrowheads indicate the division plane. (B) Pseudocolored images of increased free [Ca2+]i; (FCalG − FCNF)/FCNF × 2.5, simultaneously obtained with the images in a, demonstrating that Ca wave 1 propagates in the furrow region. Duration of Ca wave 1 is significantly shorter than that of cytokinesis. It is excluded from the contractile ring area (arrow). (C) Merged images of (A, red) and (B, green). Wave 1 is restricted to the area of newly inserted membrane. Scale bar, 0.2 mm.

