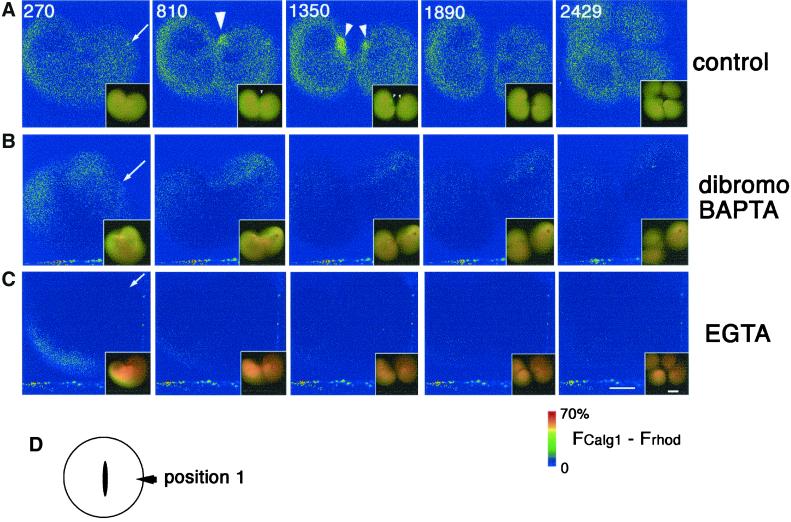
Figure 8.
dibromoBAPTA or EGTA effectively suppresses both Ca wave 1 and 2 without affecting cytokinesis. Pseudocolored time-lapse images showing the change of free [Ca2+]i after Ca chelator injections. Four nanoliters each of the injection buffer alone as control (A), 0.9 mM (final concentration in the cytosol) dibromoBAPTA (B), or 0.9 mM (final concentration) EGTA (C), were injected into dividing eggs during early furrowing at a polar region (D and arrows in A–C), and the effects on both cytokinesis and free [Ca2+]i;(FCalG − FRhod) × 1.4, were monitored. The merged raw data for CalG-dx and Rhod-dx are also presented in the right bottom of each pseudocolor image to show the appearance of the embryos. Yellow color represents the resting level of the [Ca2+]i. As the [Ca2+]i was lowered by Ca chelators, the color turned to reddish. The numbers in A indicate times (seconds) after injection. Images in B and C were obtained at the same time points. (A) In the control egg, Ca wave 1 and 2 were detected at 810 s and 1350 s, respectively (arrowheads). (B) Injection of dibromoBAPTA did not alter the free [Ca2+]i significantly as expected from its Kd for Ca ion. In the dibromoBAPTA-injected egg, both wave 1 and wave 2 were suppressed but the first cleavage was not affected or only slightly delayed. The second cleavage of the blastomere on the injection side was inhibited. Deformation occurred frequently around the site of the injection (inset of the picture of 270 s). (C) The injection of EGTA lowered the [Ca2+]i immediately and significantly. Both Ca wave 1 and wave 2 were suppressed. However, the first and second cleavages occurred normally. (D) Position of injection site. Position 1, position away from both ends of the cleavage furrow. Scale bars, 0.2 mm.

