Fig. 5.
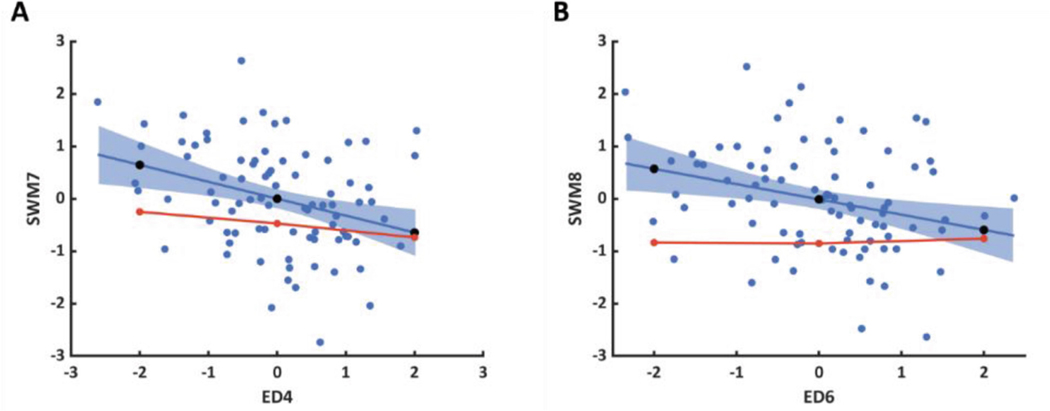
Comparison of predicted (black circles) and FE-computed (red line and circles) SWM Z-scores for shape perturbations along (A) ED4 ∝ SWM7 and (B) ED6 ∝ SWM8 using mean material properties. Significant ED shape mode and SWM mode correlations from patient data (blue circles) are represented as linear regression models with the fit (blueline) and 95% confidence intervals (blue shaded area).

