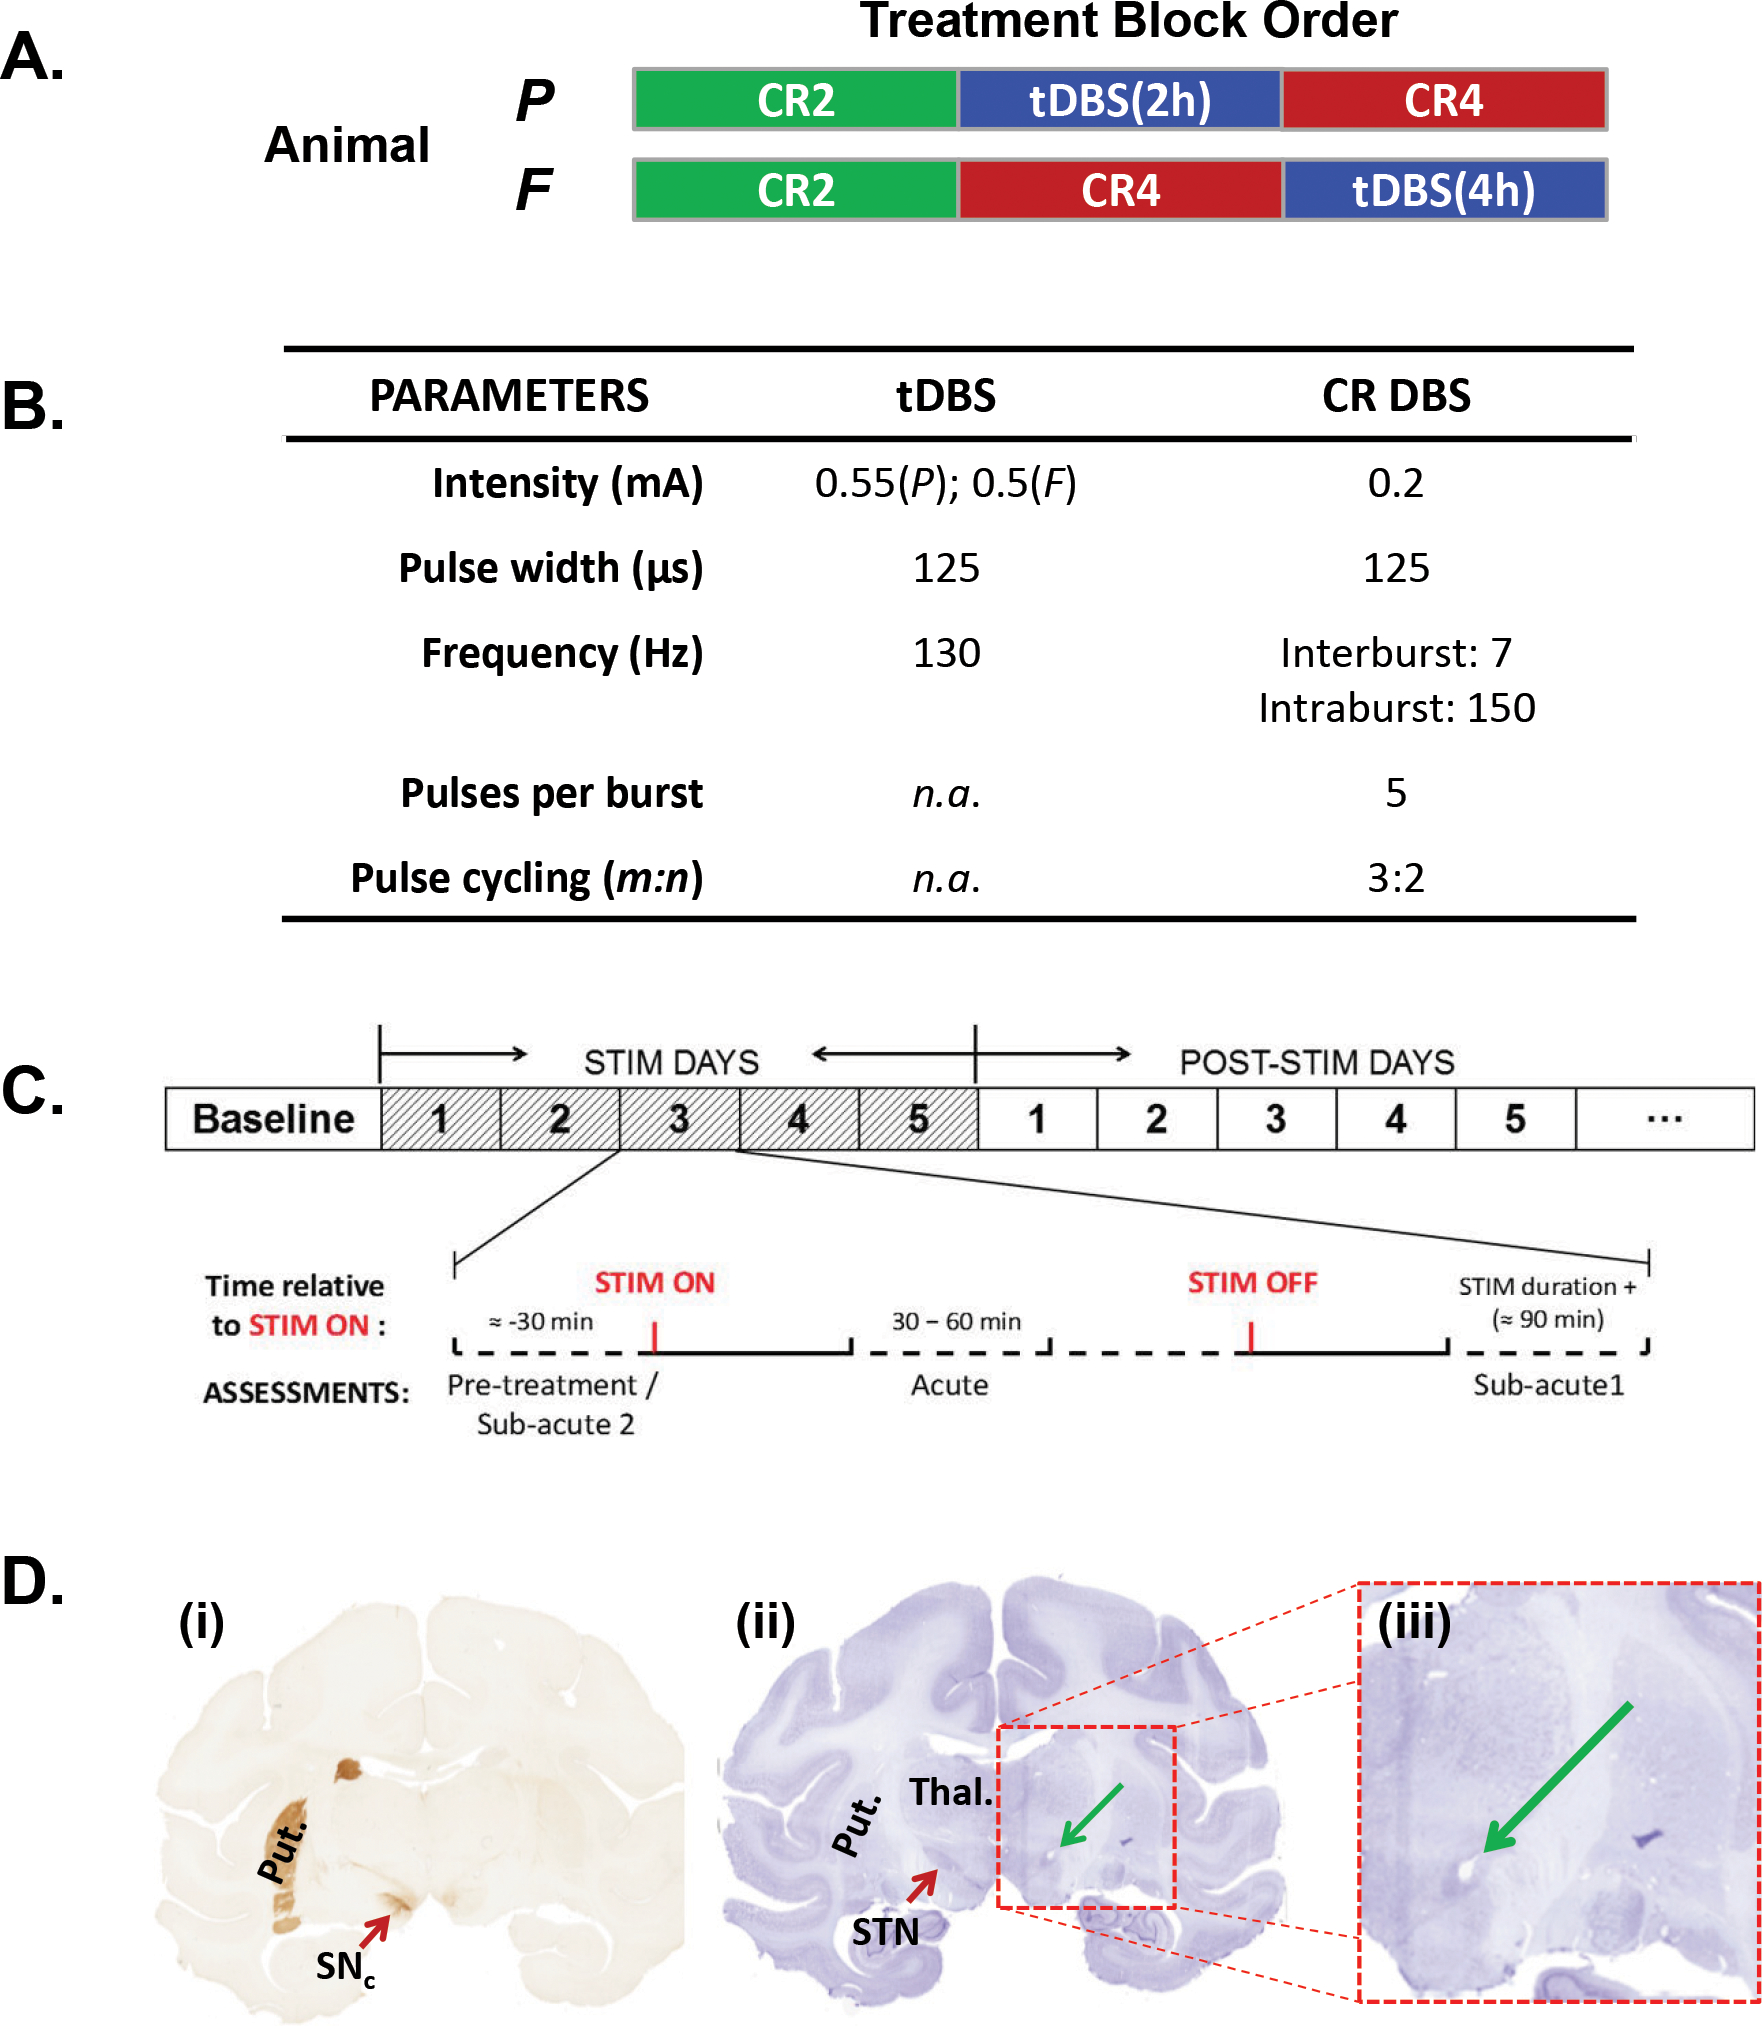
Figure 1.

(A) The order of the individual DBS treatment blocks as applied to each animal over the course of the study. (B) Stimulation parameters used for each treatment condition. With the exception of the duration of stimulus delivery (i.e., 2- versus 4-hours), the same stimulation parameters were applied during both the CR2 and the CR4 conditions. (C) Schematic illustration of the pattern of pulses used during CR DBS (modified from supplementary figure 1 in [14]). (D) Schematic overview of the sub-stages within each treatment block. As illustrated, a pre-treatment baseline period was followed by five days of daily stimulation (Treatment Phase) followed by a post-treatment phase designed to examine the magnitude and duration of carry-over effects. The magnified inset depicts the daily data collection timeline for a treatment phase day. (E) Coronal sections from animal P illustrating (i) the loss of TH+ neurons in the MPTP-treated hemisphere (right) and the relative location of the artifact (green arrow) left by placement of the DBS lead in the STN (ii & iii).
