
Figure 4.
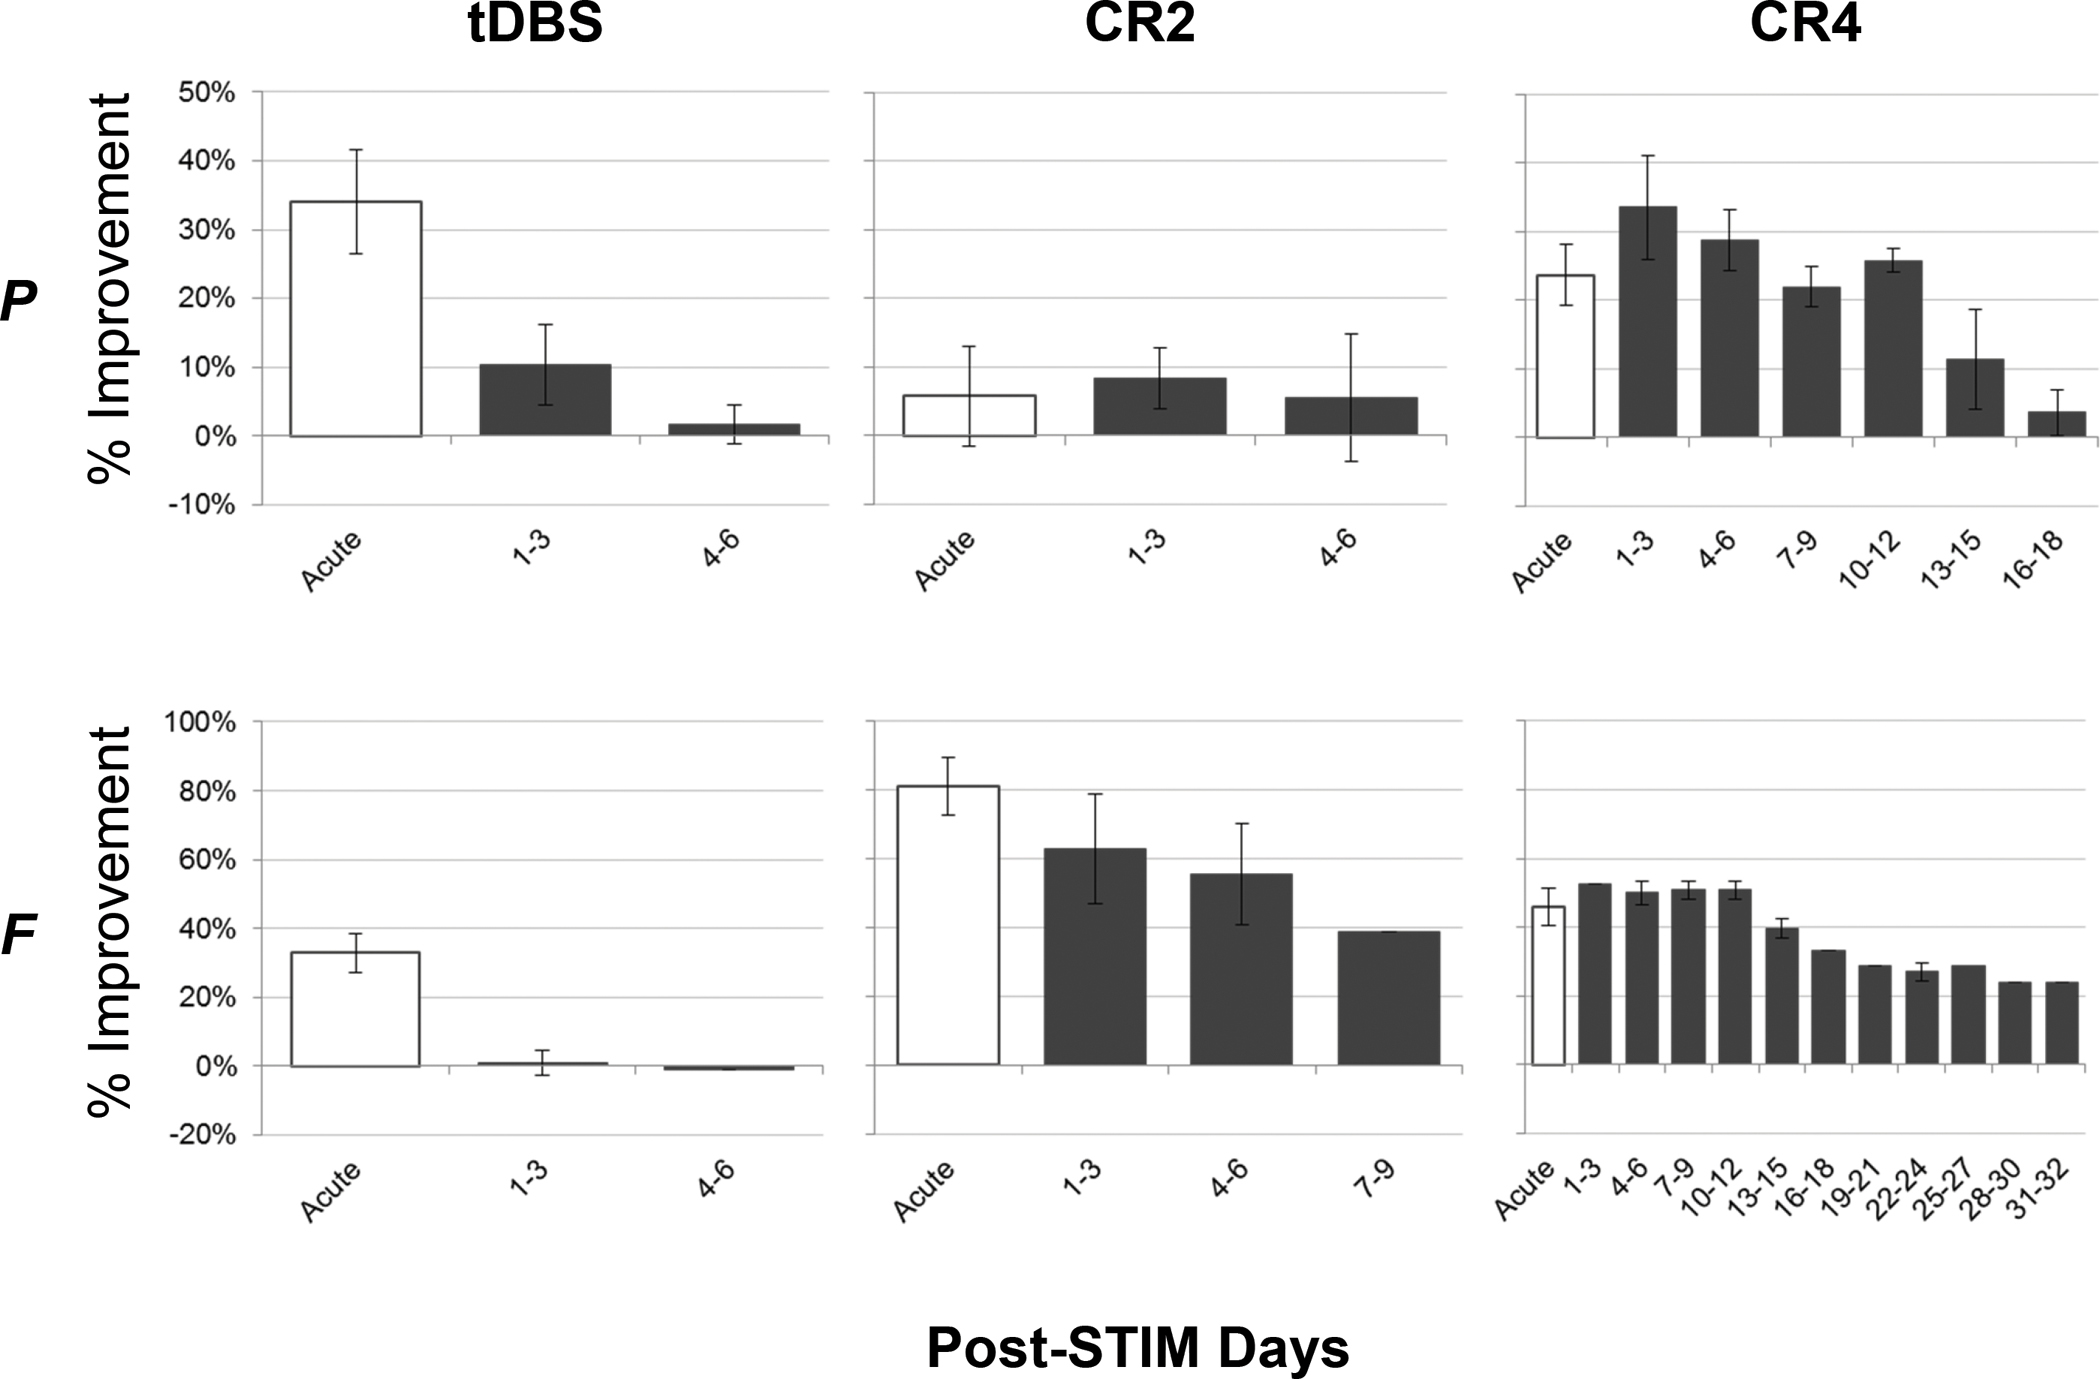
Post-treatment carry-over varied by treatment condition and animal. The mean (+/− SD) changes (%) in mUPDRS scores for each animal as a function of treatment condition following cessation of DBS (post-treatment carry-over). The acute data (white bars) are the same as shown in figure 2 and reproduced here for reference. During the post-treatment period, data are averaged using non-overlapping, three-day windows.