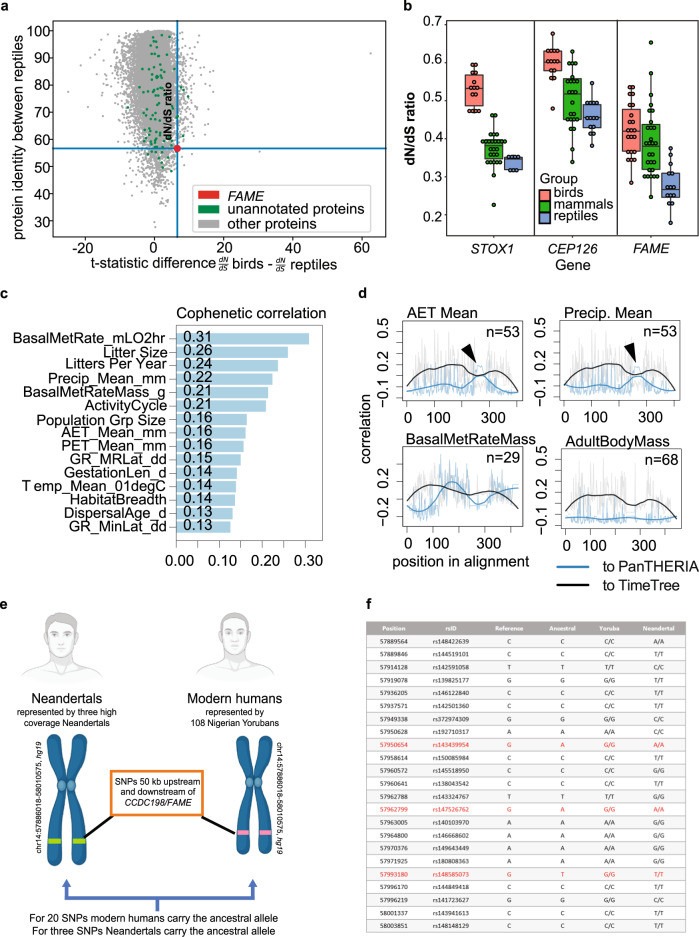
Fig. 1. FAME sequence changes during the evolutionary divergence of reptiles, birds, and mammals.
a Identification of FAME in a screen for evolutionary diverging proteins corresponding to the split of major vertebrate groups. b Comparison of dN/dS ratios of unannotated proteins of low protein identity between reptiles. Mean ± SEM and n (genome pairs): STOX1 birds 0.5297 ± 0.0120 n = 14 mammals 0.3733 ± 0.0095 n = 26 reptiles 0.3369 ± 0.0071 n = 7. CEP126 birds 0.5982 ± 0.0126 n = 14 mammals 0.5026 ± 0.0159 n = 23 reptiles 0.4581 ± 0.0116 n = 14. FAME birds 0.4235 ± 0.0150 n = 22 mammals 0.3912 ± 0.0176 n = 28 reptiles 0.2779 ± 0.0144 n = 14. Descriptive statistics can be accessed in Supplementary Data 13. c Cophenetic correlation between dendrograms obtained from amino acid sequence alignments and dendrograms based on PanTHERIA scores of different ecological factors. The longest protein sequences were obtained for 68 mammalian species using biomaRt (Ensembl). d correlation between 2-mer alignment regions to ecologic (PanTHERIA) and phylogenetic (TimeTree) dendrograms. The species count with both ecologic data and orthologue sequence available is indicated in the top right corner. Regions with trends ties are marked with arrows. These regions are likely connected with ecological factors. Other examples are shown in Supplementary Fig. 2. Notably, there are different shapes of trends and positions of the ties. e, f Single nucleotide polymorphisms (SNPs) for which Neanderthals (n = 3) and Yorubans (n = 108) homozygously carry different alleles. Genomic coordinates are in hg19. The ancestral alleles were taken from Ensembl90 and the Neanderthal alleles from previously published genomes27,28.

