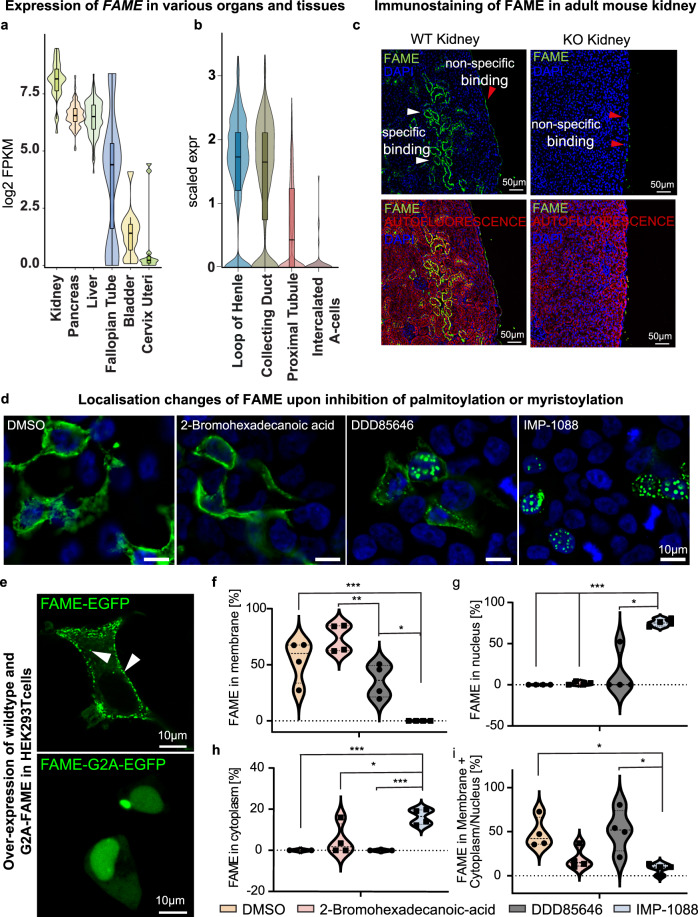
Fig. 2. FAME is highly expressed in kidneys and localises to the cell membranes and vesicles.
a Analysis of FAME expression in various human tissues based on Genotype-Tissue Expression data. FAME expression is particularly high in the kidney, pancreas, liver, and fallopian tube. Mean ± SEM and n (GTEx samples): kidney (8.071 ± 0.1468 n = 32) pancreas (6.575 ± 0.0392 n = 171) liver (6.447 ± 0.06853 n = 119) fallopian tube (4.702 ± 1.230 n = 5) bladder (1.414 ± 0.3387 n = 11) cervix uteri (0.9330 ± 0.5028 n = 11.) b Detailed expression analysis of Fame using Tabula Muris, a single-cell atlas of the mouse. The data demonstrate high expression in kidney epithelial cell types, the loop of Henle and collecting duct cells, but also in the proximal tubules. Mean ± SEM and n (single mouse cells): loop of Henle (1.546 ± 0.03942 n = 471) collecting duct (1.403 ± 0.04278 n = 443) proximal tubule (0.6419 ± 0.02091 n = 1198) intercalated A-cells (0.07076 ± 0.03823 n = 45). c Immunofluorescence of the adult wild type and knockout mouse kidney stained for FAME and imaged together with auto fluorescence. Representative image from 3 different animals is shown. See Supplementary Fig. 5 for additional stainings. d Validation of the FAME N-myristoylation site. Visualization of overexpressed fluorescently tagged FAME-EGFP in HEK293T cells upon treatment with the N-myristoylation inhibitors DDD85646 and IMP-1088 and the palmitoylation inhibitor 2-bromohexadecanoic acid (2-BP) as control. Data from 4 independent experiments is shown. e Overexpression of the fusion protein in HEK293T cells shows the localisation of FAME in the plasma membrane and intracellular vesicles (white arrows). f–i Quantification of localisation changes of overexpressed FAME-GFP upon N-myristoylation inhibition in cellular compartments. f Violin plots of the percentage of FAME-EGFP localised in the plasma membrane upon treatment with the indicated inhibitors. Mean ± SEM and n: DMSO (53.78 ± 9.491 n = 4) 2-BP (73.71 ± 6.262 n = 4) DDD85646 (35.62 ± 7.446 n = 4) IMP-1088 (0.00 ± 0.00 n = 4), p-value DMSO vs IMP-1088 = 0.0013, p-value 2-BP vs DDD85646 = 0.0078, p-value DDD85646 vs IMP-1088 = 0.0030. g Violin plots for nuclear FAME localization upon treatment. Mean ± SEM and n: DMSO (0.00 ± 0.00 n = 4) 2-BP (1.622 ± 1.029 n = 4) DDD85646 (13.10 ± 13.10 n = 4) IMP-1088 (75.36 ± 2.151 n = 4), p-value DMSO vs IMP-1088 = 0.0001, p-value 2-BP vs IMP-1088 = 0.0001. h Violin plots for cytoplasmic Fame localization upon treatment. Mean ± SEM and n: DMSO (0.00 ± 0.00 n = 4) 2-BP (4.882 ± 3.806 n = 4) DDD85646 (0.00 ± 0.00 n = 4) IMP-1088 (16.38 ± 1.882 n = 4), p-value DMSO vs IMP-1088 = 0.0001, p-value 2-BP vs IMP-1088 = 0.0351, p-value DDD85646 vs IMP-1088 = 0.0001. i Violin plots for membranous and cytoplasmic/nuclear Fame localisation upon treatment. Mean ± SEM and n: DMSO (48.09 ± 8.612 n = 4) 2-BP (19.05 ± 5.971 n = 4) DDD85646 (51.34 ± 12.16 n = 4) IMP-1088 (8.255 ± 2.894 n = 4), p-value DMSO vs IMP-1088 = 0.0046, p-value DDD85646 vs IMP-1088 = 0.0137. Source data are provided as a Source Data file.

