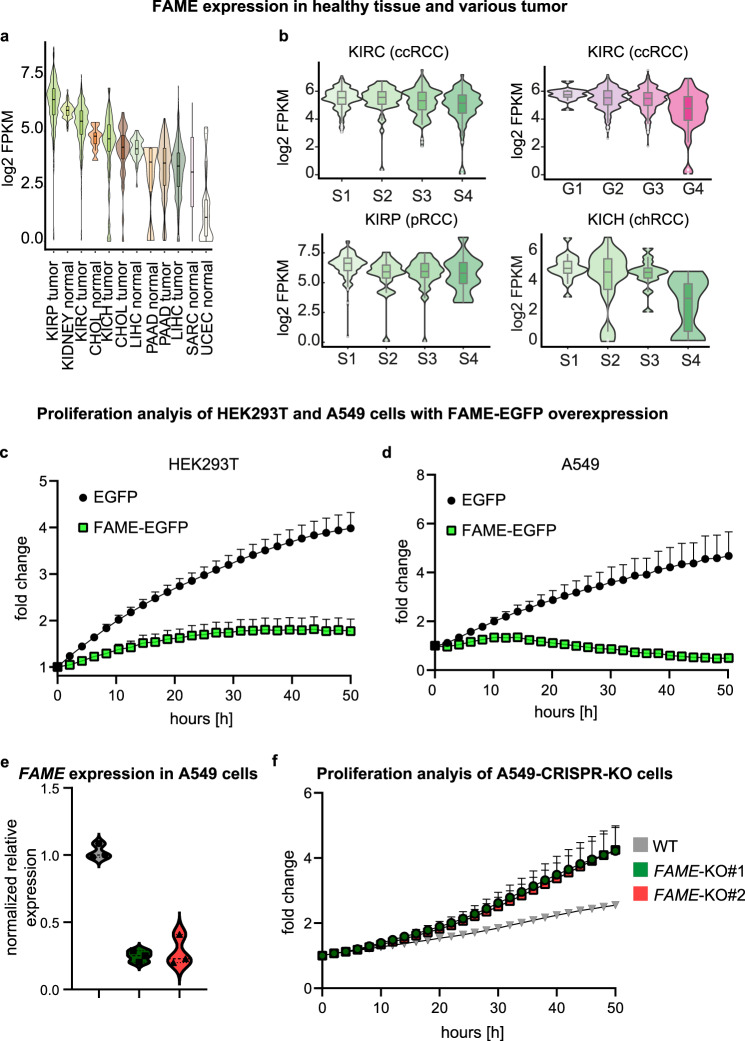
Fig. 7. Association of FAME with cancer.
a Analysis of FAME expression in various tumors and healthy tissues using RNAseq data obtained from The Cancer Genome Atlas (TGCA) Program. Mean ± SEM and n (tumor or healthy tissue samples): KIRP tumor (6.251 ± 0.0671 n = 289) kidney normal (5.916 ± 0.0301 n = 126) KIRC tumor (5.309 ± 0.0418 n = 530) CHOL normal (4.663 ± 0.1816 n = 9) KICH tumor (4.331 ± 0.1988 n = 65) CHOL tumor (4.056 ± 0.2020 n = 36) LIHC normal (4.199 ± 0.0688 n = 50) PAAD normal (2.872 ± 0.9882 n = 4) PAAD tumor (3.319 ± 0.0996 n = 178) LIHC tumor (3.255 ± 0.0623 n = 373) SARC normal (3.145 ± 3.145 n = 2) UCEC normal (1.295 ± 0.2736 n = 24). b FAME expression in kidney tumors (TCGA data) stratified by tumor grade (G)/stage (S). The expression is maintained in all tumor types derived from FAME expressing tissue. Mean ± SEM and n (tumor samples): KIRC S1 (5.437 ± 0.0472 n = 266) KIRC S2 (5.451 ± 0.1307 n = 57) KIRC S3 (5.236 ± 0.0894 n = 123) KIRC S4 (4.905 ± 0.1459 n = 81) KIRP S1 (6.455 ± 0.0737 n = 172) KIRP S2 (5.816 ± 0.3306 n = 22) KIRP S3 (5.811 ± 0.1692 n = 51) KIRP S4 (5.743 ± 0.3829 n = 15) KICH S1 (4.917 ± 0.1813 n = 20) KICH S2 (4.200 ± 0.3868 n = 25) KICH S3 (4.541 ± 0.2704 n = 14) KICH S4 (2.438 ± 0.8041 n = 6). c Proliferation analysis of HEK293T cells overexpressing FAME-EGFP or an EGFP control plasmid. EGFP+ cells were included in the analysis. Mean values of 5 independent cell clones per condition with positive error bars (SEM) are shown. Figure d as in c using human A549 cells. e Normalized RNA expression levels of FAME in A549 cells measured by qPCR. Technical replicates (n = 3) of two independent KO clones and one wildtype clone are shown. f Proliferation analysis of A549 clones in which FAME was knocked out using the CRISPR-Cas9 system. As control (WT), a FAME-sgRNA-transduced, but unedited clone in the locus of interest, was included. Mean values from 3 independent experiments with 2 replicates each per KO or WT clone (n = 6), with positive error bars (SEM), are shown. Source data are provided as a Source Data file. c, d, f Error bars are shown as positive SEM from the mean. Some bars are smaller than data symbols.

