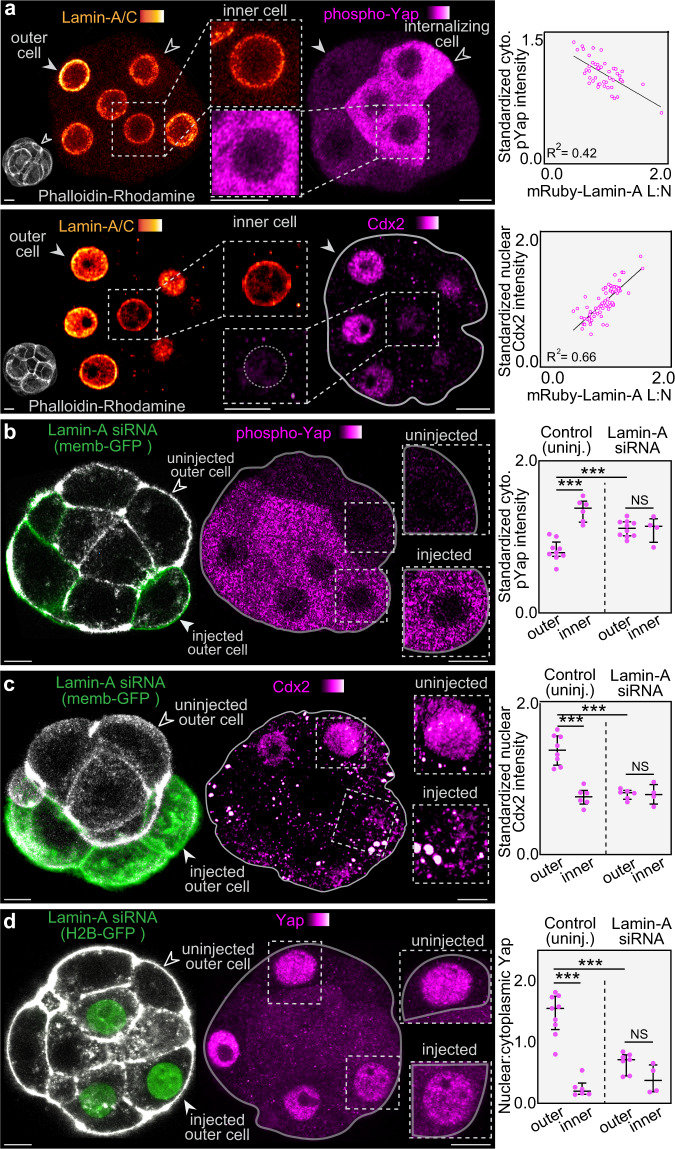
Fig. 3. Lamin-A controls the transcriptional regulators Yap and Cdx2.
a, Cytoplasmic intensity of phospho-Yap and nuclear Cdx2 correlate with Lamin-A/C L:N. Open arrowhead indicates a cell undergoing internalization via apical constriction. n = 48 for phospho-Yap, n = 71 for Cdx2, R2 = 0.42 for phospho-Yap, R2 = 0.66 for Cdx2. b–d, Knockdown of Lamin-A by siRNA causes an increase in cytoplasmic phospho-Yap levels (b), a reduction in nuclear Cdx2 levels (c) and a reduction in nuclear:cytoplasmic Yap levels (d). siRNAs were microinjected into a single cell of the 2-cell embryo. Membrane-GFP or H2B-GFP was used to label injected cells (arrowheads). For (b) n = 9 for control outer, n = 6 for control inner, n = 10 for Lamin-A siRNA outer, n = 4 for Lamin-A siRNA inner. ***P = 0.0004 for control inner vs control outer, ***P = 0.0006 for control outer vs Lamin-A siRNA outer, NS > 0.999. For (c) n = 8 for control outer, n = 6 control inner, n = 6 Lamin-A siRNA outer, n = 4 Lamin-A siRNA inner. ***P = 0.0007 for control inner vs control outer, ***P = 0.0007 for control outer vs Lamin-A siRNA outer, NS = 0.9143. For (d) n = 9 for control outer, n = 6 for control inner, n = 7 for Lamin-A siRNA outer, n = 4 for Lamin-A siRNA inner. ***P = 0.0004 for control inner vs control outer, ***P = 0.0003 for control outer vs Lamin-A siRNA outer, NS = 0.0727. All statistical tests are two-tailed. Fluorescence intensities represent results standardized to DAPI. Bars in dot plots represent median and interquartile range. Scale bars, 10 µm Source data are provided as a Source Data file.

