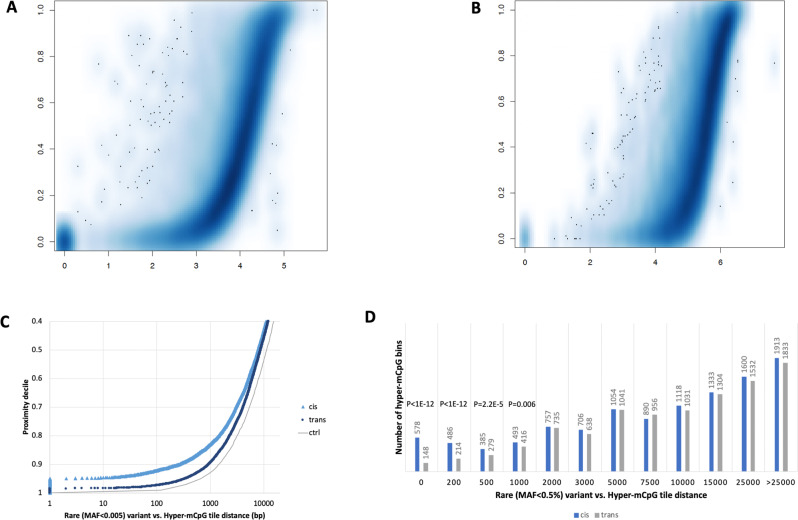
Fig. 4. Association of genetic variants with rare hypermethylation outliers.
Scatter plot depicting the distance (x axis, log10 base pair (bp)) between rare hyper-mCpG tiles and closest rare A single nucleotide variant (SNV) (with minor allele frequency (MAF) < 0.5% based on gnomAD) and B structural variant (SV) (with MAF < 1% based on present study population data). Same process was repeated for, in parallel, for same tile in all other individuals to obtain a percentile rank of tile-variant distances in the population. Empirical q value (y axis) threshold (dashed black line, q < 0.1) corresponding to estimated distance of associated rare variant of rare hyper-mCpG tiles (red solid line). C Scatter plot depicting haplotype-resolved distance (x axis, bp) between rare hyper-mCpG tiles and closest rare SNV (0.5% MAF gnomAD) in cis (same read, light blue triangle) and trans (opposite read, dark blue round). Same process was repeated for, in parallel, for same tile in all other individuals to obtain a percentile rank (y axis) of tile-variant distances in the population. Gray line depicts null distance distribution of rare SNVs (<0.5% MAF gnomAD) in our sample set. D Bar graph depicting number of extreme hyper-mCpG tiles (y axis) linked to rare SNV in cis (same read, blue bars) or trans (opposite read, gray bars) based on distance. P values from a two-sided binomial test assuming equal number of tiles in cis and trans for at each distance (x axis, bp).

