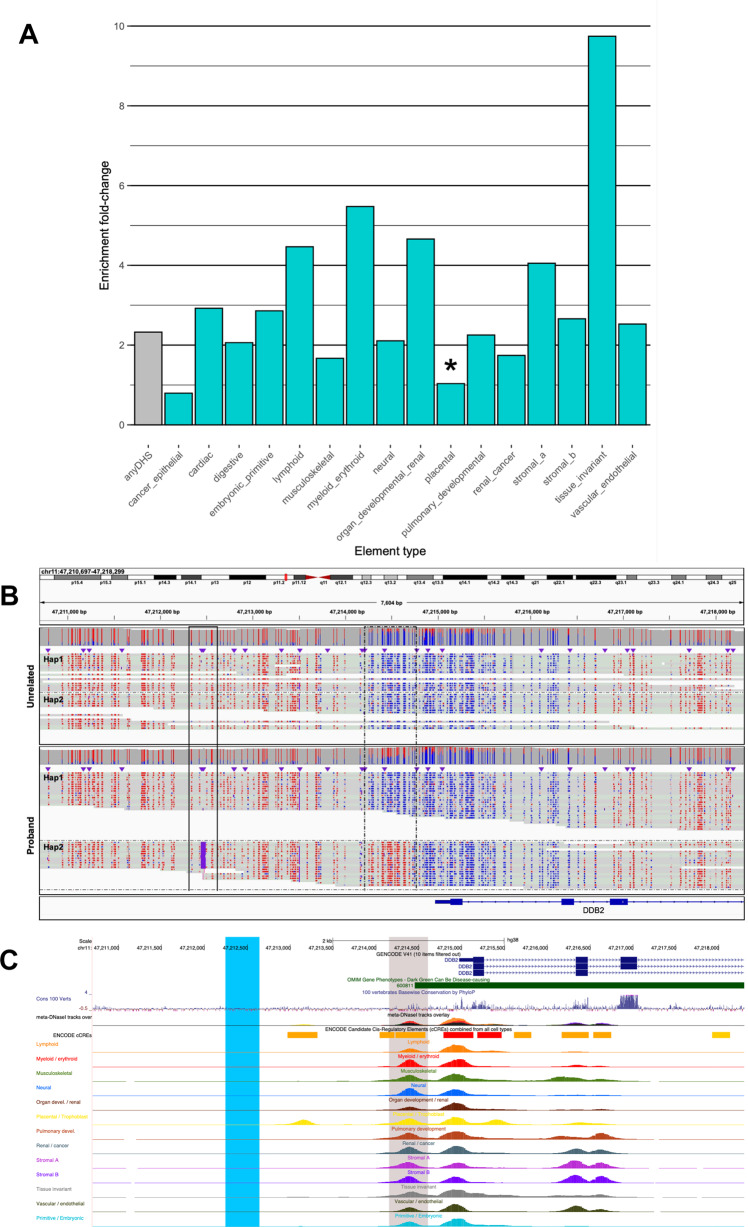
Fig. 5. Regulatory element annotation of rare hypermethylation outliers.
A Bar graph depicting the fold enrichment (y axis) of the overlap of regulatory elements (assessed by DNase I hypersensitive site (DHS) mapping) with extreme hyper-mCpG tiles compared to background control tiles. Enrichment is presented as either overlapping any DHS site (gray bar) or specific to tissue states (turquoise bars). Significance is based on two-sided Fisher’s exact test where all element types have P values < 2.2E-16, except “cancer_epithelial” (P = 2.00e-08) and placental (P = 0.251, not significant, indicated with asterisk). B Genomics view of 7.6 kb at the DDB2 disease locus comprising an insertion (black box, solid like) resolved by HiFi-genome sequencing (GS) that results in 1 kb proximal promoter hypermethylation (black box, dashed line). Haplotype-resolved CpG modification coloring (blue indicating unmethylated CpG prediction and red indicating methylated CpG prediction with color intensity corresponding to base modification probabilities) is shown in proband and unrelated sample. Hap1 denotes haplotype 1 and Hap2 denotes haplotype 2. C Zoomed in genomics view depicting regulatory element (DHS) annotation of the hyper-mCpG tile (gray box) nearby causal insertion (blue box).

