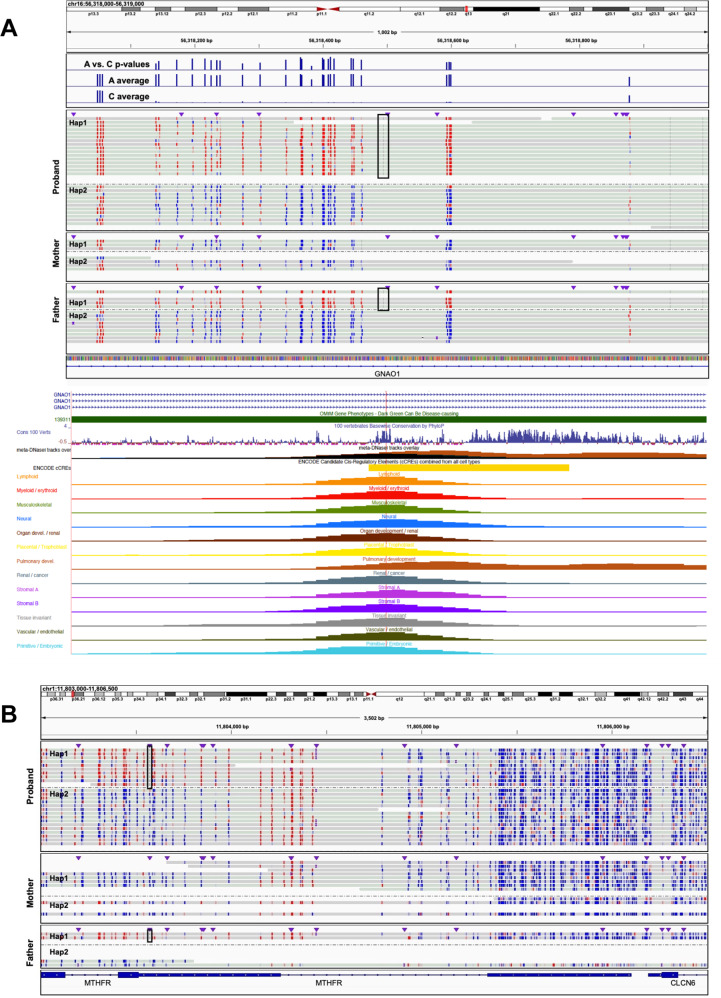
Fig. 6. Disease genes with rare hypermethylation event in regulatory elements.
A Genomic view of ~1 kb on chromosome 16 at the GNAO1 locus showing a paternally inherited rare (minor allele frequency <0.3%) intronic C-to-A single nucleotide variant (SNV) at chr16:56,318,495 (black rectangle). Haplotype-resolved CpG modification coloring (blue indicating unmethylated CpG prediction and red indicating methylated CpG prediction with color intensity corresponding to base modification probabilities) is shown in the complete trio. Hap1 denotes haplotype 1 and Hap2 denotes haplotype 2 in the respective sample. Top track shows P values (y axis, −log10(0–31)) from two-sided Fisher’s exact test for CpG methylation differences in rare A versus common C-allele carrying reads, respectively. Second and third track from the top shows the average CpG methylation rate (y axis, 0–100%) across all A (rare) and C (population prevalent) carrying reads, respectively. Genome browser view depicts the rare SNV (red line) overlapping a vertebrate-constrained sequence and conserved regulatory element active across tissue types. B Genomic view of ~3.5 kb on chromosome 1 at the MTHFR locus showing a paternally inherited rare 5’UTR SNV (black box) which maps into an extended ~1 kb extreme hyper-mCpG tile at the MTHFR proximal promoter. Haplotype-resolved CpG modification coloring (blue indicating unmethylated CpG prediction and red indicating methylated CpG prediction with color intensity corresponding to base modification probabilities) is shown in the complete trio. Hap1 denotes haplotype 1, and Hap2 denotes haplotype 2 in the respective sample.

