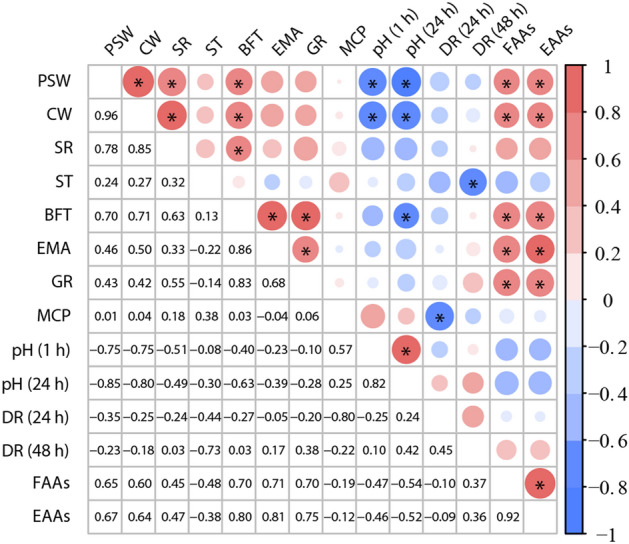
Figure 6.

Analysis of the correlation between production performance and meat quality of Hu sheep. Statistical significance was calculated by Spearman’s correlation analysis (*p < 0.05). The size and intensity of the colored circles are proportional to the correlation values. PSW pre-slaughter weight, CW carcass weight, SR slaughter rate, ST skin thickness, BFT back fat thickness, EMA eye muscle area, GR grade rule, MCP meat cooking percentage, pH (1 h) and pH (24 h) = pH of the longissimus dorsi muscle at 1 h and 24 h after slaughter, DR (24 h) and DR (48 h) drip rate of 24 h and 48 h after slaughter, FAAs flavor amino acids, EAAs essential amino acids.
