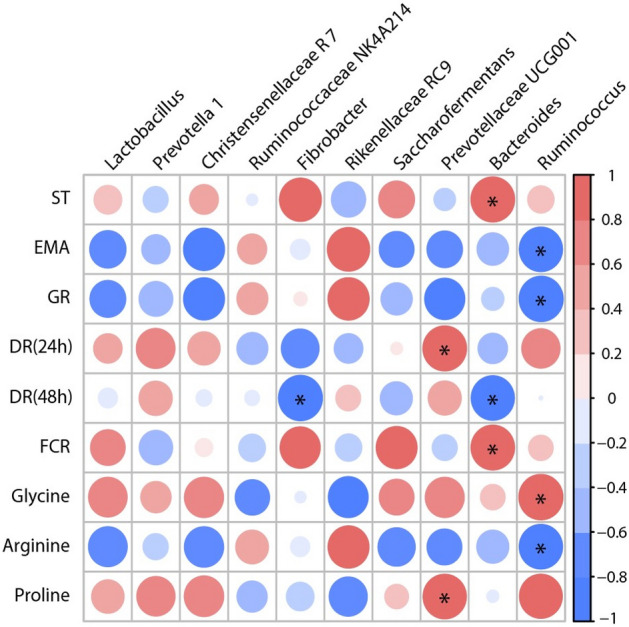
Figure 7.

Analysis of the correlation between relative abundance of rumen bacterial based on genus level and production performance or meat quality of Hu sheep. Statistical significance was calculated by Spearman’s correlation analysis (*p < 0.05). The size and intensity of the colored circles are proportional to the correlation values. ST skin thickness, EMA eye muscle area, GR grade rule, DR (24 h) and DR (48 h) drip rate of 24 h and 48 h after slaughter, FCR feed conversion ratio.
