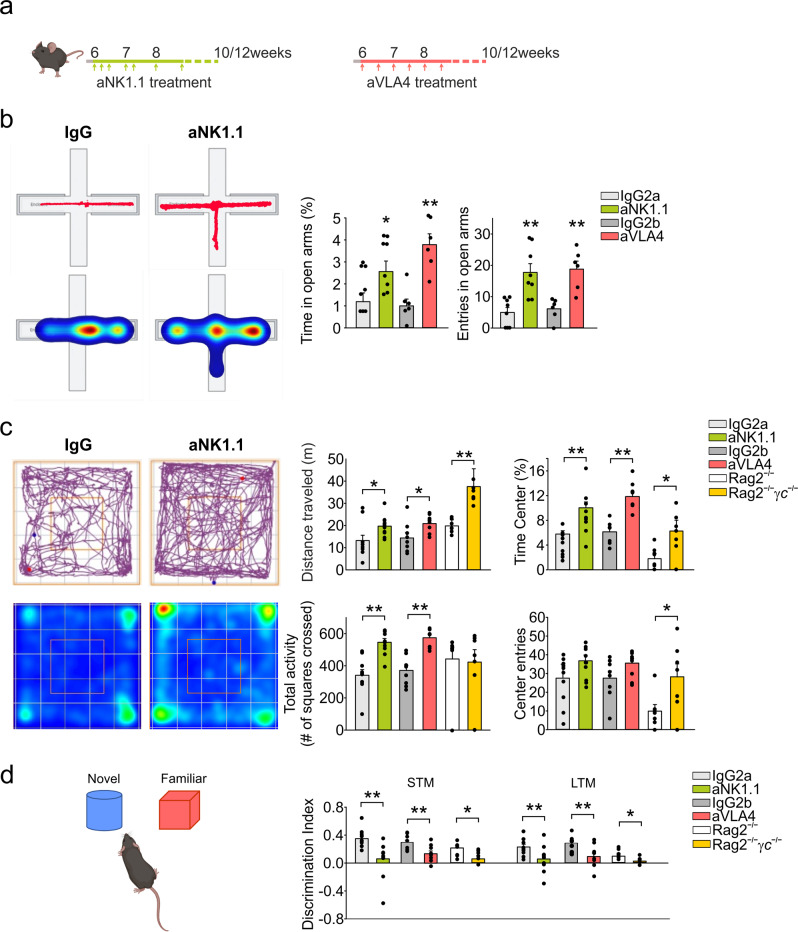
Fig. 2. Role of NK cells and ILC1 in mice behavior.
a Scheme of aNK1.1 and aVLA4 treatments in C57BL/6 mice. b The percentage of time spent and the frequency of entries in the open arms in elevated plus maze in IgG2a and aNK1.1 treated mice (n = 8 mice per condition; *p = 0.048, **p < 0.001 two-tailed Student’s t test), and IgG2b and aVLA4 treated mice (n = 6 mice per condition, **p < 0.001 two-tailed Student’s t test). Data are expressed as mean ± SEM. c Open-field test (10 min) results for IgG2a-, aNK1.1-, IgG2b-, aVLA4-treated mice (n = 10 IgG2a and aNK1.1, n = 8 IgG2b and aVLA4 mice), and Rag2−/− and Rag2−/−γc−/− mice (n = 7 per condition) showing total distance traveled (*p = 0.039 IgG2a vs aNK1.1 mice, *p = 0.037 IgG2b vs aVLA4 mice, **p = 0.002 Rag2−/− vs Rag2−/−γc−/−), percent time spent in the center (**p < 0.001 IgG2a vs aNK1.1 and IgG2b vs aVLA4 mice, **p = 0.022 Rag2−/− vs Rag2−/−γc−/−), center episodes (p = 0.102 IgG2a vs aNK1.1 mice, p = 0.151 IgG2b vs aVLA4 mice, *p = 0.036 Rag2−/− vs Rag2−/−γc−/−), and the total activity (**p < 0.001 IgG2a vs aNK1.1 and IgG2b vs aVLA4 mice; two-tailed Student’s t test). Data are expressed as mean ± SEM. d Discrimination index analyzed after 1 h (short term memory - STM) and 24 h (long term memory - LTM) in mice treated with IgG2a, aNK1.1, IgG2b and aVLA4 (n = 10 IgG2a and aNK1.1, n = 8 IgG 2b and aVLA4 mice, **p = 0.003 IgG2a vs aNK1.1, **p = 0.004 IgG2b vs aVLA4, one-way ANOVA), and in Rag2−/− and Rag2−/−γc−/− mice (n = 7 mice per condition, *p = 0.011 one-way ANOVA). Data are expressed as mean ± SEM. c, d Open-field test results on distance traveled for IgG2a-treated mice vs Rag2−/− and Rag2−/−γc−/− (**p < 0.01 IgG2a vs Rag2−/− mice, **p < 0.001 IgG2a vs Rag2−/−γc−/− mice, two-way ANOVA). Object novelty discrimination in IgG2a-treated mice vs Rag2−/− and Rag2−/−γc−/− mice (STM **p < 0.001 IgG2a vs Rag2−/− and Rag2−/−γc−/− mice; LTM **p < 0.01 IgG2a vs Rag2−/− mice, two-way ANOVA). Data are representative of at least two experiments with similar results. a, d Figure created with BioRender.com.

